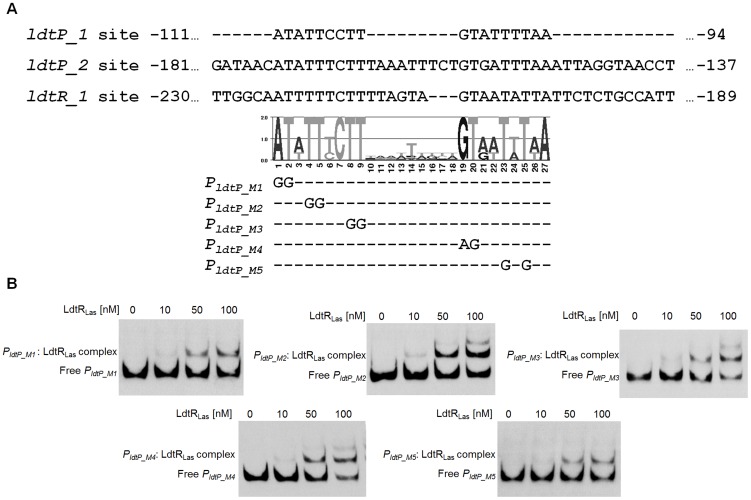
Figure 3. Characterization of LdtRLas binding site.
(A) Alignment of LdtRLas binding sites ldtP_1, ldtP_2, and ldtR_1. Graphical representation (LOGO) of the position specific frequency matrix constructed with LdtRLas binding sites. Double substitutions on the most conserved nucleotides were carried out in PLdtP probe. The location of each mutated nucleotide is depicted on probes PldtP_M1, PldtP_M2, PldtP_M3, PldtP_M4, and PldtP_M5. (B) EMSAs were conducted on PldtP_M1, PldtP_M2, PldtP_M3, PldtP_M4, or PldtP_M5 probes with increasing concentrations of LdtRLas, as indicated on top of each panel. No protein was added to the first lane.

