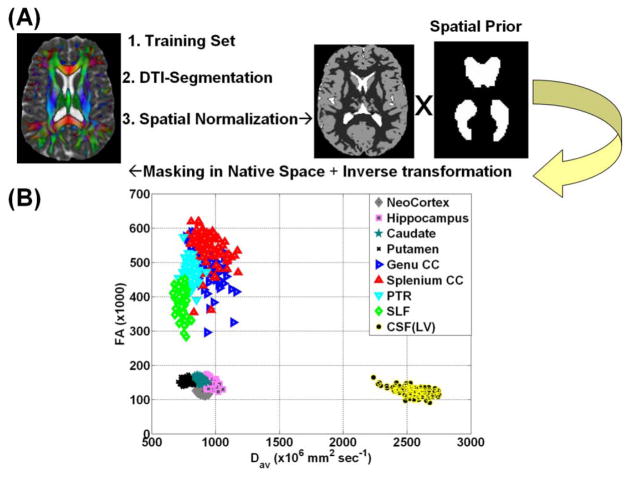
Figure 1.
(A) A flow chart of the main steps used in segmentaing the LV in native space using the DTI contrast, spatial normalization and LV template (B) A two-dimensional scatter plot of the MD vs. FA of several representative white matter, gray matter structures and lateral ventricular CSF. Note that MD(LV) ~ 2.5 * MD(parenchyma) enabling reliable CSF segmentation.

