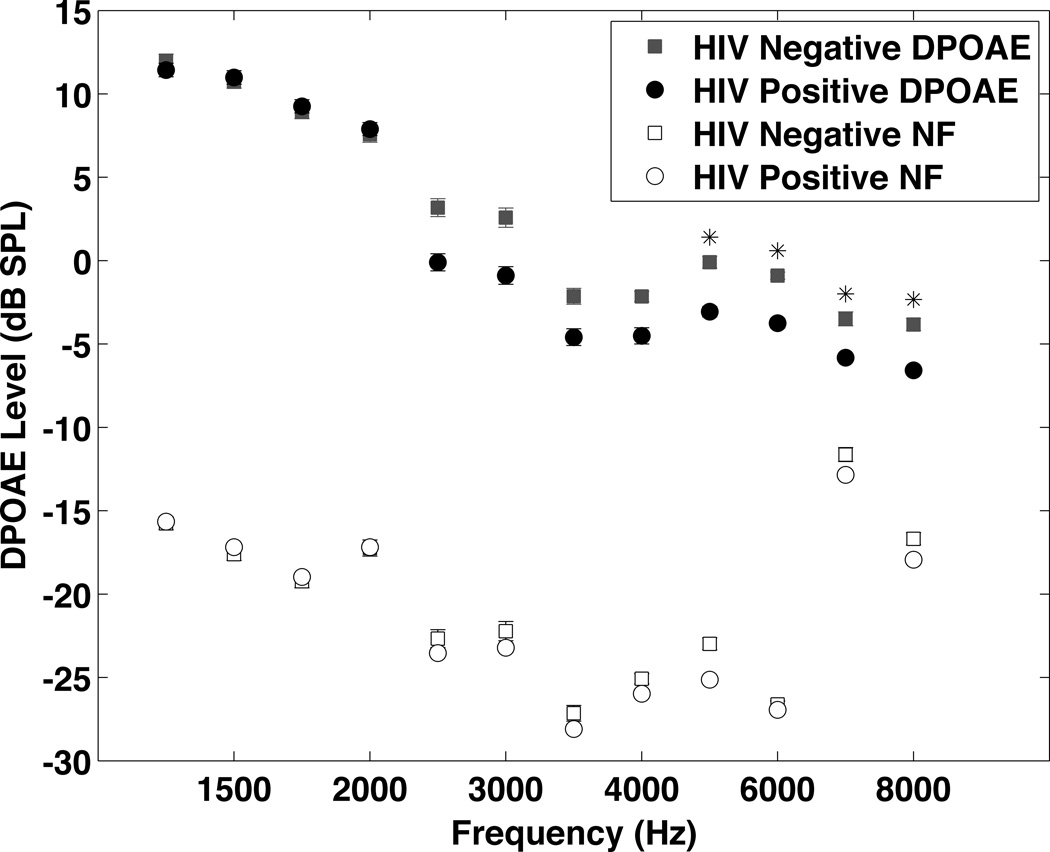
Figure 3.
DPOAE results from the HIV+ and HIV− groups. Due to missing data the number of subjects in the analysis for each frequency ranged from 374 to 434 for the HIV+ group and from 170 to 197 for the HIV− group. Since the results were the same for both ears, the data from both ears have been averaged to simplify data presentation. DPOAEs were significantly lower in the HIV+ group at multiple frequencies. This difference was significant at 6000 Hz and above (6000 Hz p=0.005, 6200 Hz p=0.0.15, 7800 Hz p=0.01, 8000 Hz p=0.002). All the average DPOAE levels were above the average noise floor (the noise floor was below −10 dB for all frequencies). Data were analyzed statistically using propensity score matching.

