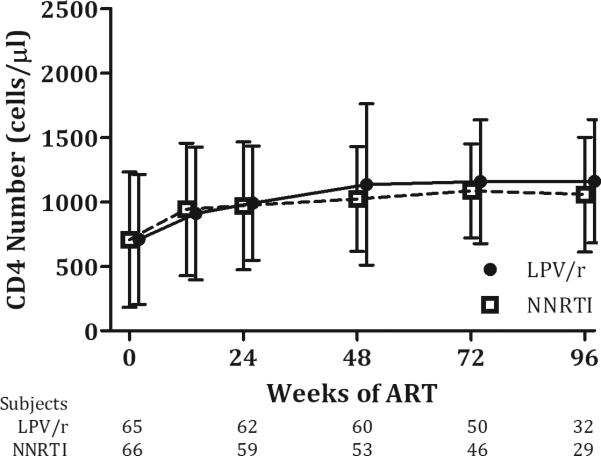
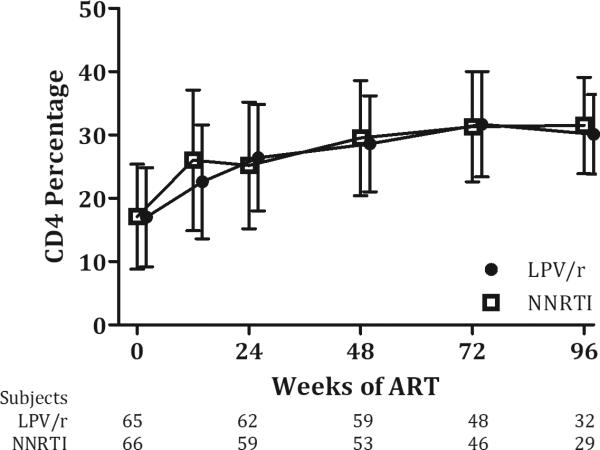
Figure 3. Change in CD4 measures over time, ART-naive.
a) CD4 Number b) CD4 Percentage
CD4 count and percentage by duration of time receiving ART during the study. Values are means with standard deviation error bars. Data were included from subjects on per-protocol basis with some patients missing scheduled visits at each time point, as shown below.


