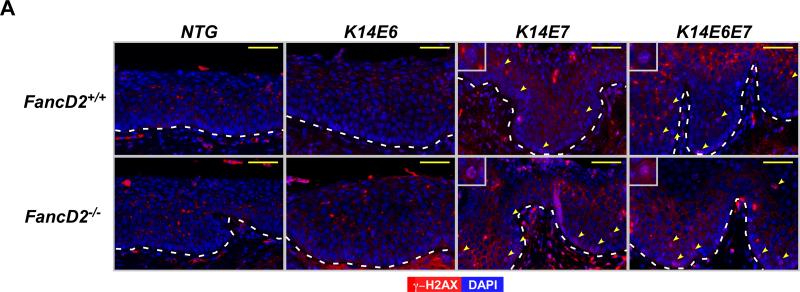
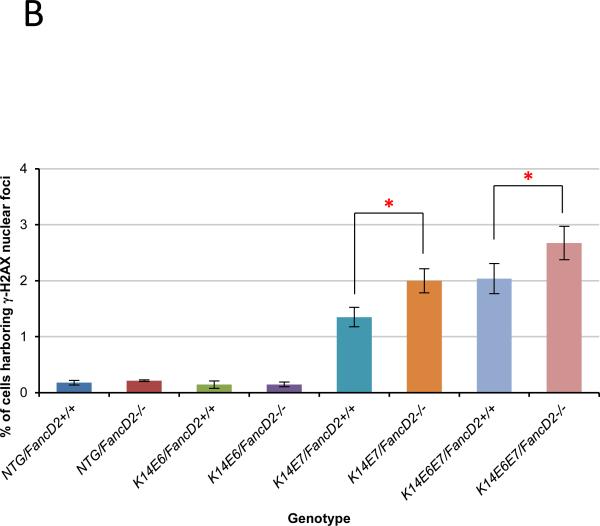
Figure 4. FancD2 deficiency induced E7-dependent DNA damage response via β-H2AX.
A, to detect DNA damage response, tissue sections from each group were stained for anti-γ-H2AX (Red) antibody. DAPI (Blue) is used for a nuclear counterstaining. Scale bar, 50 μm. γ-H2AX nuclear-foci positive cells are highlighted by yellow arrows in the images. Insets provide magnified views of cells with γ-H2AX positive nuclear-foci. The white dot line indicates basal membrane. B, at least three mice from NTG, K14E6, K14E7, and K14E6E7 mice in the presence and absence of fancD2 expression were randomly selected and more than eight image frames of cells at the epithelia of cervix were quantified for each mouse. The amount of γ-H2AX nuclear-foci positive cells over total number of cells was plotted in each case (columns); bar, Standard deviation (SD). In the epithelial layer of the cervical tissues, E7 expression and E6/E7 double expression significantly induced the number of γ-H2AX nuclear-foci positive cells on fancD2-sufficient background (NTG/FancD2 or K14E6/FancD2+/+ vs. K14E7/FancD2+/+ or K14E6E7/FancD2+/+; P<0.05). fancD2 deficiency statistically increased proliferation in K14E7 and K14E6E7 mice (K14E7/FancD2+/+ vs. K14E7/FancD2−/− and K14E6E7/FancD2+/+ vs. K14E6E7/FancD2−/−; P<0.05), not in NTG and K14E6 mice. Asterisk (*) means significant difference (P<0.05). NS means no significant difference (P>0.05). All statistical comparisons were performed using a two-sided Wilcoxon Rank sum test.


