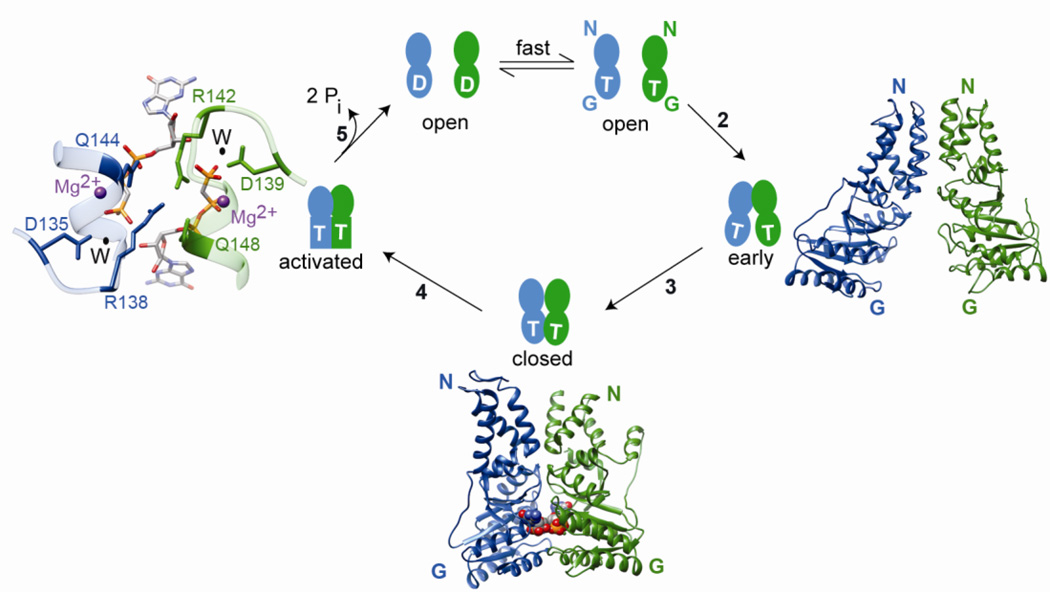
Fig. 3.
SRP and SR are multi-state regulatory GTPases that undergo a series of conformational changes during their GTPase cycle. For clarity, only the NG-domains of SRP and SR are shown. T and D represent GTP and GDP, respectively. Under cellular conditions, nucleotide exchange on free SRP and SR is rapid and the proteins exist predominantly in the GTP-bound state. Step 2: SRP and SR GTPases first associate to form an early intermediate, which primarily involves interactions between the two N-domains. The right panel shows a molecular model for the early complex (PDB ID: 2xkv). Step 3: the G-domains of both proteins gain closer approach to one another, forming a closed complex with an extensive binding interface. The bottom panel shows a co-crystal structure of the SRP-FtsY NG domain complex (PDB ID: 1rj9) in the closed/activated conformation. The non-hydrolyzable GTP analog GMPPCP is shown in space filling model. Step 4: rearrangement of the IBD loops optimizes the position of catalytic residues relative to GTP, generating the activated conformation for efficient GTP hydrolysis. The left panel shows a magnification of the composite active site at the dimer interface for GTPase activation. The active site Mg2+ is in magenta, nucleophilic water (W) is in black and the catalytic residues of SRP (blue) and SR (green) are indicated. Step 5: GTP hydrolysis drives the disassembly and recycling of SRP and SR. The steps are numbered to be consistent with Figures 2 and 4.

