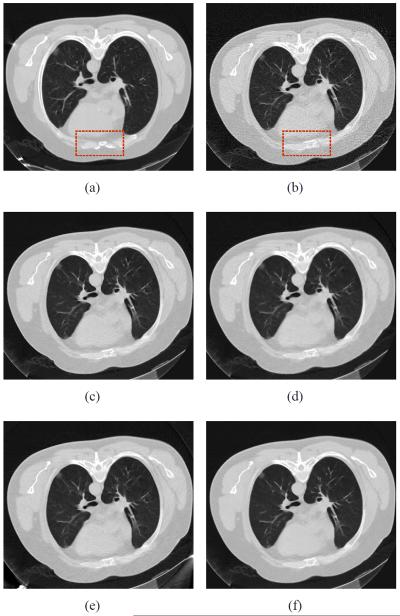
Fig. 13.
Clinical chest CT image reconstructions. (a) the image reconstructed by the FBP method with ramp filter from the sinogram data acquired at 200 mAs, 120 kVp, which is used as the prior image for the PWLS-PINL and PICCS methods; (b) image reconstructed by the FBP with ramp filter from the sinogram data acquired at 20 mAs, 120 kVp; (c) image reconstructed by the PWLS-NL method from the sinogram data acquired at 20 mAs, 120 kVp (N = 21 × 21, n = 5 × 5, h = 0.6 × 10⁻³, β = 1.0 × 10⁴); (d) image reconstructed by the PICCS method from the sinogram data acquired at 20 mAs, 120 kVp (α = 0.5, λ = 0.1); (e) the image reconstructed by the GDSIR method from the sinogram data acquired at 20 mAs, 120 kVp (γ = 4×10⁻²); and (f) image reconstructed by the PWLS-PINL method from the sinogram data acquired at 20 mAs, 120 kVp (N = 41×41, n = 5×5, h = 0.6×10⁻³, β = 1.0×10⁴). All the images are displayed in the window [0 0.02] mm−1.

