Figure 2.
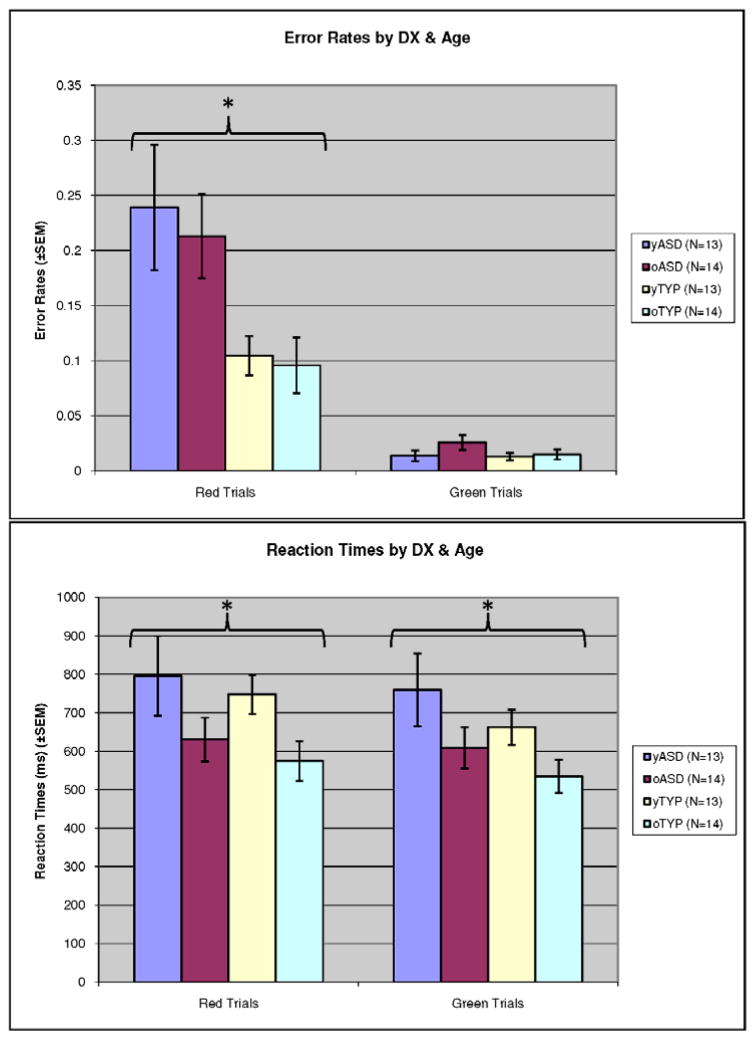
Behavioral Findings: (A) Red and green trial error rates by age and diagnosis. (B) Red and green trial reaction times by age and diagnosis.
This figure shows behavioral findings for red and green trial error rates by age and diagnosis, and red and green trial reaction times by age and diagnosis. There is a significant main effect of diagnostic group on red trial error rates. (ASD perform worse than TYP), with both groups improving (non-significantly) over time. (B) There is a main effect of age such that reaction times on both red and green trials decrease with age.

