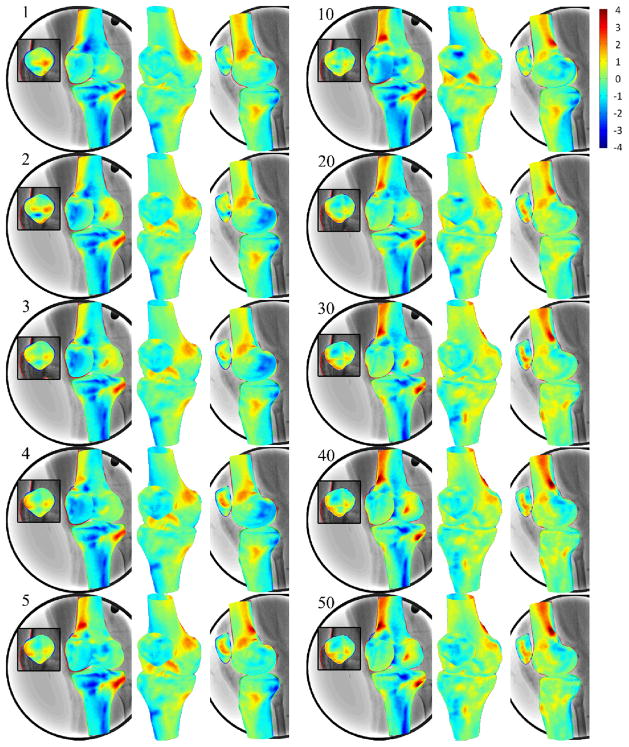
Figure 7.
3D surface rendering of SSMs of the femur, tibia and patella with color representing of the difference from CT reconstruction models. Positive or negative values indicate that predicted nodes were inside or outside of the CT models. Numbers on the upper left indicated the number of principal components used in SSM for prediction. While the number of the principal components increasing in SSM, the 2D projection of the SSM getting closer to the contours on fluoroscopic images.

