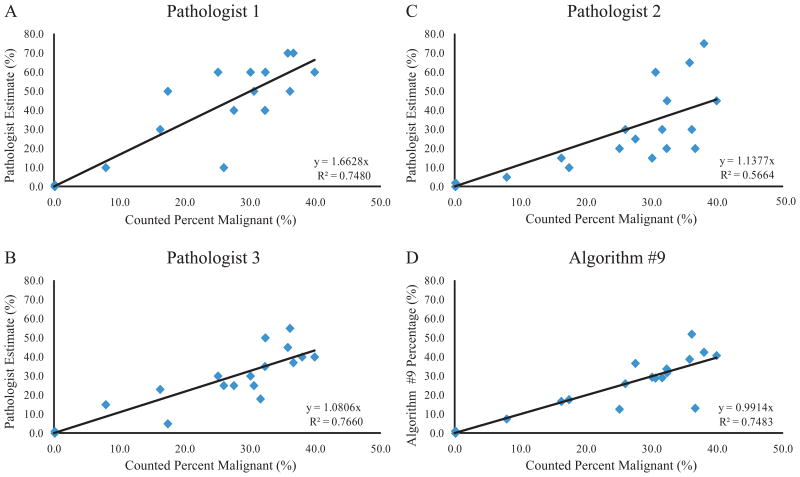
Figure 7.
Algorithm #9 and Pathologist Accuracy in the Critical Low Range for Mutation Testing. Pathologist estimates and Algorithm #9 values were plotted versus the criterion standard for images containing less than 40.0% malignant nuclei. Results are shown for Pathologist 1 (A), Pathologist 2 (B), Pathologist 3 (C), and Algorithm #9 (D). All regression intercepts were set to zero. Line of regression equation and R-squared value are shown for each panel.

