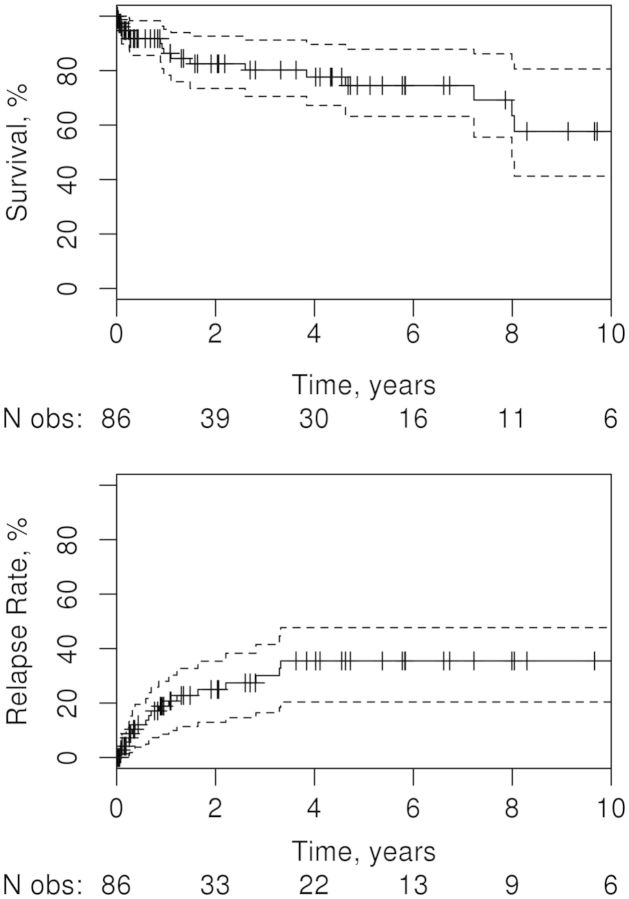
Fig. 2.
Kaplan–Meier plots depicting survival rate (upper panel) and relapse rate (lower panel) in 86 patients with rheumatoid vasculitis
The solid line in each plot shows the estimated rate over time, with hashed lines showing where patients are censored; dotted lines are 95% CIs. The numbers beneath each plot show the number of patients still under observation at the corresponding time points.

