Figure 2.
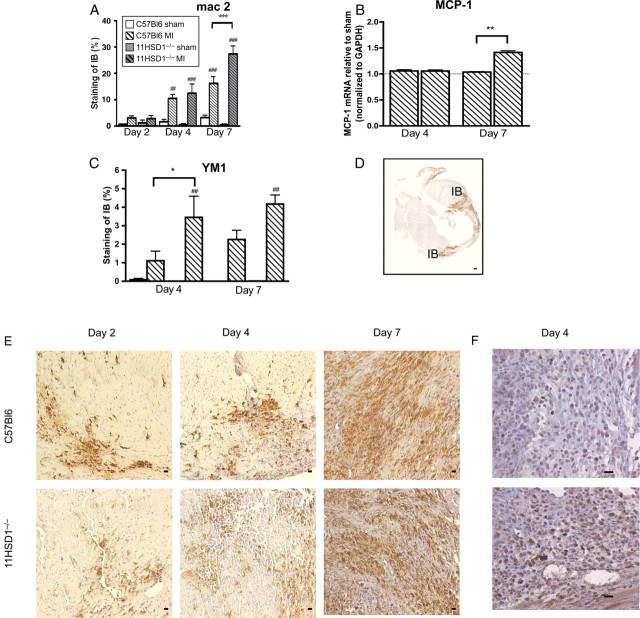
Macrophage accumulation during infarct healing. (A, D, E) mac 2 immunohistochemistry was used to detect macrophage infiltration and was quantified as percent staining of the infarct border (IB). (B) Monocyte chemoattractant protein-1 (MCP-1) mRNA levels in heart tissue normalized to GAPDH housekeeping gene. (C, F) YM1-positive staining in heart tissue showing alternatively activated macrophages and quantified as percent staining of the infarct border. YM1 staining was absent from the hearts of mice that underwent sham operation (C). n = 8, C57BL/6 sham; n = 12, C57BL/6 MI; n = 4, 11βHSD1−/− sham; n = 6, 11βHSD1−/− MI; for RT–PCR n = 6 per group. ##P < 0.01, ###P < 0.001 (sham versus MI). *P < 0.05, **P < 0.01, ***P < 0.001 (C57BL/6 versus 11βHSD1−/−). Scale bar, 10 μm.

