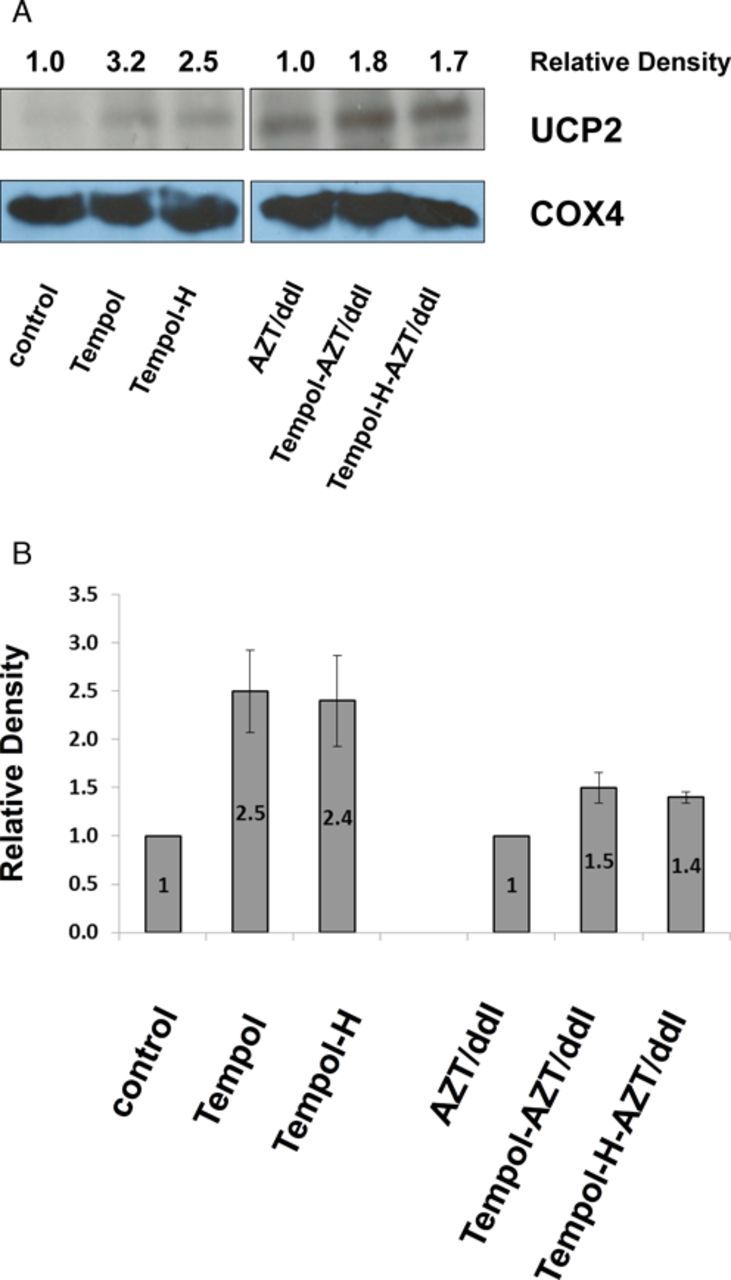
FIG. 3.

Tempol stimulated induction of UCP2. (A) Representative Western blot showing UCP-2 protein levels in P5 H9c2 cells. Quantitation was performed using ImageJ software, where each number represents the density of a specific band, normalized to the corresponding COX4 band, and expressed relative to the appropriate control (designated as 1). (B) Graph showing fold-increase (mean ± SE, n = 3 experiments) for UCP2 intensity in P5 cells, determined by Western blot. The unexposed cells (designated 1) were compared with cells exposed to Tempol or Tempol-H, and the AZT/ddI-exposed cells (designated 1) were compared with the cells exposed to AZT/ddI/Tempol and AZT/ddI/Tempol-H.
