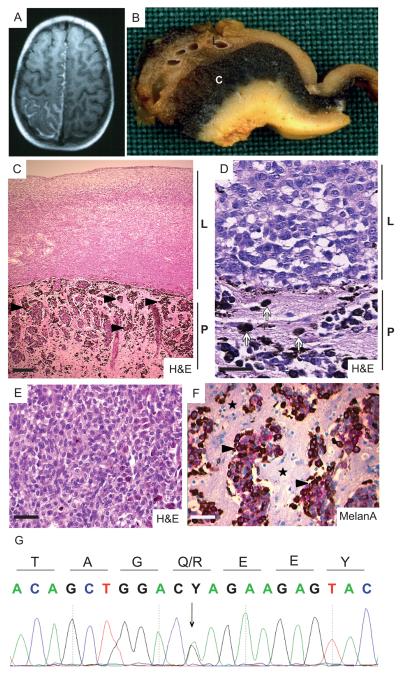
Figure 4. Diagnosis of leptomeningal melanomatosis carrying an oncogenic mutation in NRAS in patient 1.
(A) Axial T1-weighted MRI revealing a hyperintense, contrast-enhancing lesion in the left parieto-occipital region following the gyri and sulci.
(B) Photograph showing macroscopic appearance of the cerebral tissue from patient 1. Brownish discoloration of the thickened leptomeninges (L) and black discoloration of the underlying cerebral cortex (C) are evident.
(C) Photomicrograph showing H&E staining of the melanoma revealing the proliferation of hypopigmented cells in the leptomeninges (L) and invasion of hyperpigmented cells (black arrowheads) into the CNS parenchyma (P). Scalebar = 100μm.
(D) Photomicrograph showing H&E staining of the melanoma. Note the epithelioid morphology of the non-pigmented atypical cells in the leptomeningeal compartment (L) and pigmented tumor cells (white arrows) invading the CNS parenchyma (P). Scalebar = 25μm.
(E) Photomicrograph showing detail of epithelioid morphology of pleomorphic melanoma cells in the leptomeningeal compartment. Scalebar = 50μm.
(F) Photomicrograph showing MelanA staining of the pigmented melanoma cells (black arrowheads) in the CNS parenchyma (black stars). Scalebar = 50μm.
(G) Forward sequence of DNA from the primary CNS melanoma from patient 1 showing the presence of an NRAS c.182A>G, p.(Q61R) mutation (arrow).

