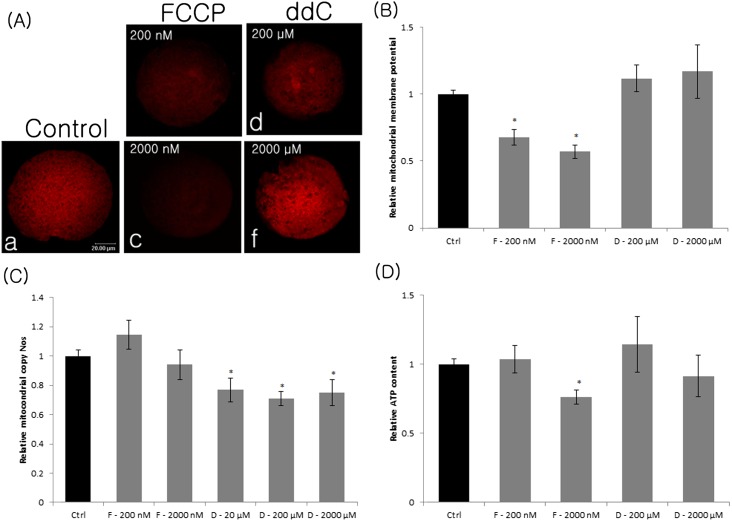
Fig. 1.
Mitochondrial membrane potential (A, B), relative mtDNA copy number (C), and relative ATP content (D) in FCCP- or ddC-treated MII oocytes. Membrane potential was calculated as a ratio of the red florescence, which corresponded to activated mitochondria (J-aggregates) (A), to the green fluorescence, which corresponded to less-activated mitochondria (J-monomers, data not shown). Data corresponding to the control was arbitrarily set at 1. Ctrl, control; F, FCCP; D, ddC. Values represent means ± SEM from at least three separate experiments. *, P < 0.05, compared with the control.

