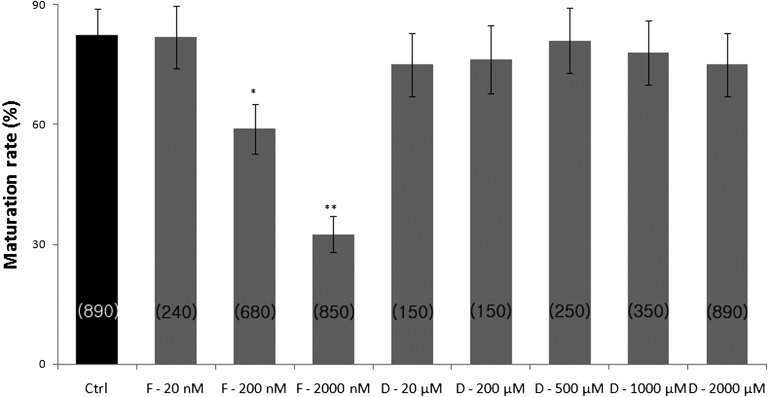
Fig. 2.
Percentage of maturation in FCCP- or ddC-treated MII oocytes. The number of oocytes examined in each treatment group is shown in parentheses. Ctrl, control; F, FCCP; D, ddC. Values represent means ± SEM from at least five separate experiments. *P < 0.05 compared with the control, **P < 0.01 compared with the control.

