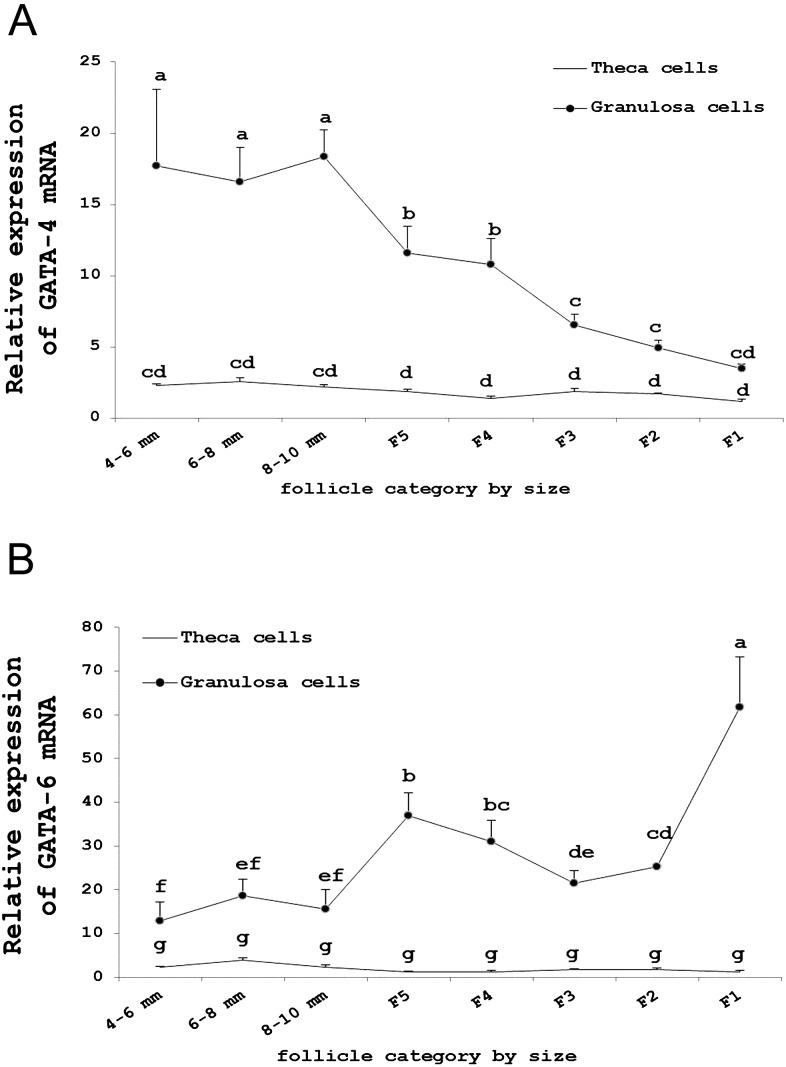
Fig. 4.
A: Relative expression level of GATA-4 mRNA in granulosa and theca cells in different sized follicles. B: Relative expression level of GATA-6 mRNA in granulosa and theca cells in different sized follicles. The expression values were normalized to β-actin and 18S and were compared using the 2^(−ΔΔCt) method. The data are presented as the mean ± SD (n=3). The lowercase letters indicate significant differences (P<0.05).

