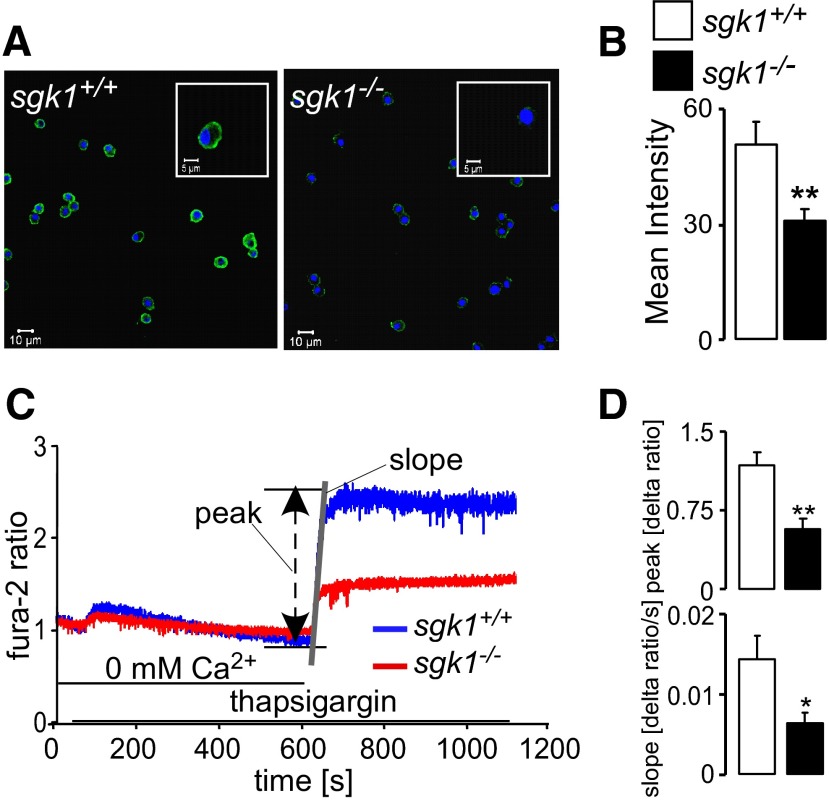
Figure 4.
Orai1 protein abundance and SOCE in BMMCs from sgk1+/+ and sgk1−/−mice. A) Confocal microscopy of Orai1 protein abundance in sgk1+/+BMMCs (left panel) and sgk1−/− BMMCs (right panel). Nuclei are blue (DRAQ5); Orai1 is green (FITC-conjugated antibody). B) Arithmetic means of Orai1 protein abundance, estimated by confocal microscopy (n=5 independent experiments; 16 cells/experiment). C) Representative tracings of Fura-2 fluorescence ratio in sgk1+/+BMMCs and sgk1−/−BMMCs during and after Ca2+ depletion in the presence of thapsigargin (5 μM). D) Arithmetic means (n=5 independent experiments; 5×10⁵ cells/experiment) of peak (Δ ratio) and slope (Δ ratio/s) of Fura-2 fluorescence ratio increase following readdition of Ca2+ in sgk1+/+BMMCs (open bars) and sgk1−/−BMMCs (solid bars), measured by fluorescence spectrometry. Values are means ± se. *P < 0.05, **P < 0.01; t test.

