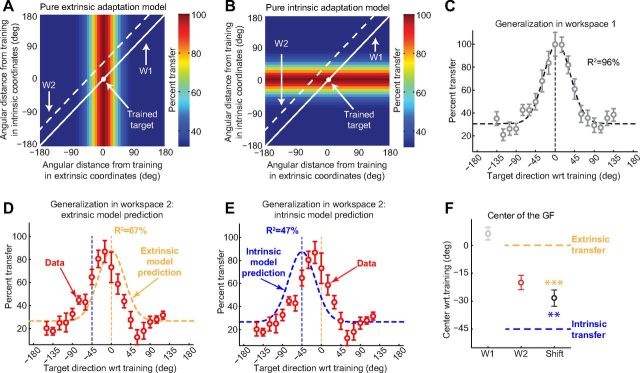
Figure 2.
Single reference frame models. A, B, Pure extrinsic and pure intrinsic adaptation models. The framework used here is the same as the one used in Figure 1D. The trained target is represented as a white dot at the origin (0°, 0°), and the corresponding motor adaptation is scaled to 100% (dark red). W1 and W2 are represented as solid and dashed lines, respectively, and their locations are consistent with Figure 1D. In the extrinsic model, generalization falls off along the extrinsic (x) axis but remains invariant along the intrinsic (y) axis. The intrinsic model (B) makes orthogonal predictions: the generalization is invariant along the extrinsic axis but variable along the intrinsic axis. C–E, Generalization data from W1 and W2. The data from W1 (C) is well approximated by a Gaussian centered at 4.7° with a width (σ) of 30.7° (R2 = 96.3%). The data from W2 is poorly approximated by the extrinsic model prediction (D; R2 = 67.2%) or the intrinsic model prediction (E; R2 = 47.4%). F, Generalization function (GF) centers. In this plot, all values are calculated by fitting Gaussians to individual subject data and averaging the center locations across subjects. In W1, the center is at 6.4°, not significantly different from zero (p > 0.1), whereas the center in W2 is at −19.8°. The shift of the generalization function from W1 to W2 is −28.2° on average, significantly different from −45° and 0° (**p < 0.01; ***p < 0.001).

