
Figure 3.
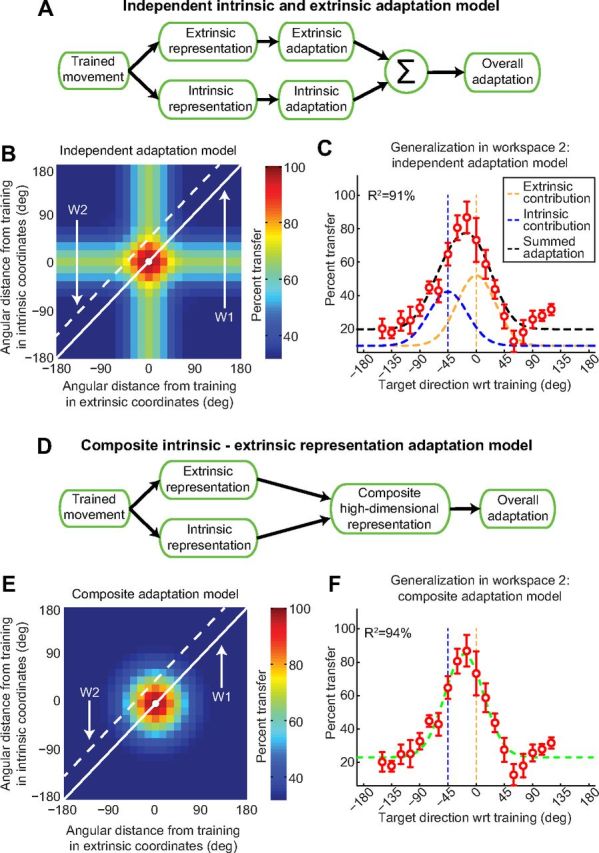
Comparison of two models for motor memory that combine intrinsic and extrinsic representations. A, Diagram of the independent adaptation model. Two representations of the trained movement (intrinsic and extrinsic) adapt independently of each other, and the overall adaptation is simply the sum of the two. B, Predictions from the independent adaptation model in the same format as Figure 2, A and B. As depicted by the plus sign generalization pattern, the trained adaptation retains a non-zero value along both the intrinsic and extrinsic axes. This is a result of the summation of the intrinsic and extrinsic generalization patterns shown in Figure 2, A and B. C, According to the independent adaptation model, the generalization pattern in W2 (black) should be equal to a weighted sum of intrinsic (blue) and extrinsic (orange) components each with a width identical to that observed in W1. This model explains 91.2% of the variance in the W2 data. D, Diagram of the composite gain-field I-E adaptation model. E, Predictions from the composite adaptation model in the same format as B. The generalization pattern has an “island” shape, indicative of a decrease in adaptation away from the trained movement. This arises from a bivariate Gaussian function centered at the origin. F, According to the composite model, the total adaptation (green) should be a single Gaussian with a width equal to that observed in W1 but shifted and scaled. This model explains 94.3% of the variance in the W2 data.