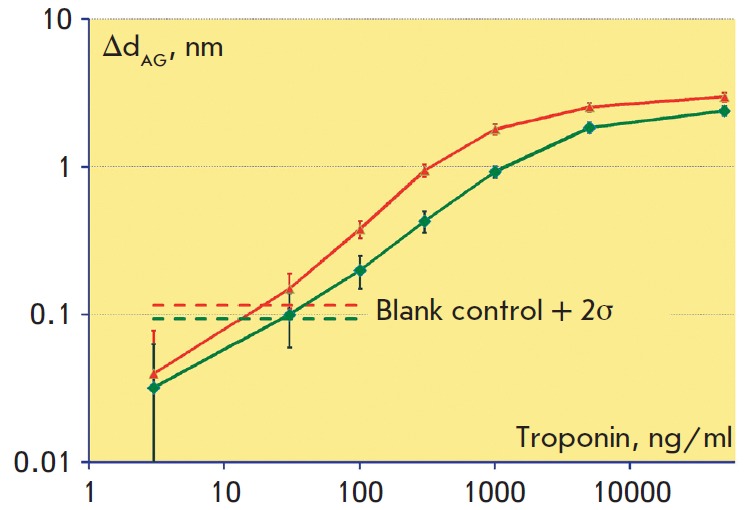
Fig. 6.

Calibration curves in log-scale obtained in a labelfree mode on biotinylated (bottom green curve) and epoxylated (top red curve) surfaces show the dependence of the biolayer increase ΔdAG upon the cardiac troponin concentration. The horizontal dashed lines represent values that exceed the negative control values by two standard deviations of the negative control in the absence of the antigen
