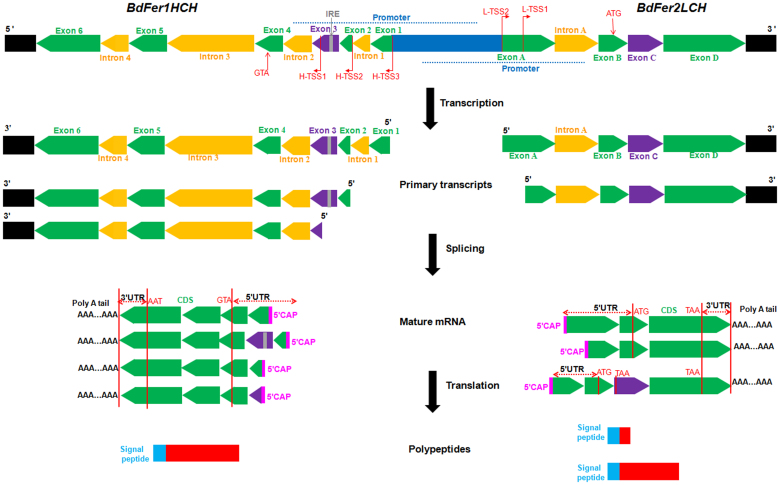
Figure 1. Schematic representation of gene organization and expression patterns of Bactrocera dorsalis ferritin.
Constitutive exons are shown as green blocks, alternatively spliced exons are shown as purple blocks, introns as yellow blocks, the intergenic regions as blue blocks, approximate promoter regions as blue dashed lines, other regulatory regions as black blocks, the IRE as a gray box, the 5′ cap as a purple box. The exons and introns of BdFer1HCH and BdFer2LCH are named using Arabic numerals and capital letters, respectively. The location of alternative TSSs is indicated using broken arrowed lines; the arrow indicates the direction of transcription. The location of start and stop codons are also shown. The UTR regions are indicated with double arrow lines. The 3′ UTR may vary for each transcript, although they are indicated using the same block. The poly(A) tails are also indicated. Putative signal peptides are shown as light blue boxes, and the mature polypeptides as red boxes. Locations and sizes are not to scale.

