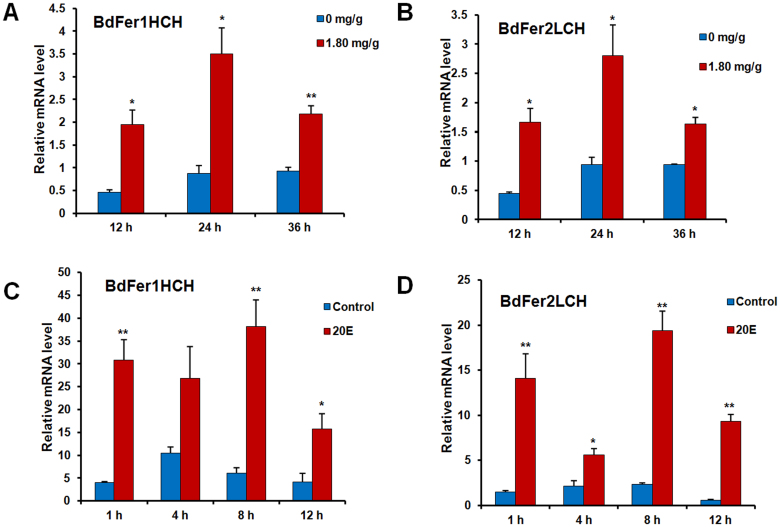
Figure 4. Relative expression levels of Bactrocera dorsalis ferritin after iron overload and 20E injection.
(A, B) Expression levels of BdFer1HCH and BdFer2LCH after a diet supplemented with 0 mg/g or 1.8 mg/g FeCl3 for 12, 24, and 36 h. (C, D) Effect of 20-hydroxyecdysone (20E) on transcript abundances of BdFer1HCH and BdFer2LCH in third-instar larvae at 1, 4, 8, and 12 h post injection. All results are represented as mean 2−ΔCt values of three independent biological replicates ± SEM. The two-tailed, unpaired t-test was used to test significance. Asterisks indicate significant differences in relative expression. (*, p < 0.05; **, p < 0.01).

