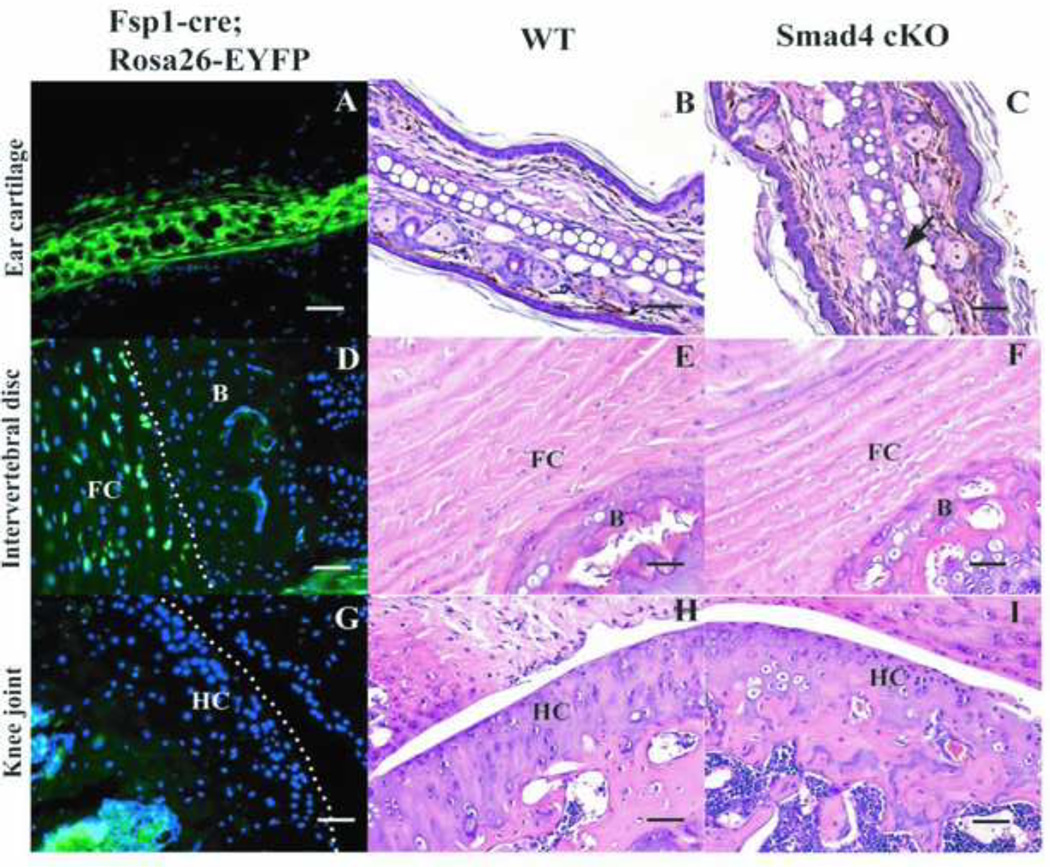
Figure 3. Expression profile of Fsp1 in different types of the cartilages. A. D. G. J. are sections of the cartilages from Fsp1-cre; Rosa26-Eyfp mice.
YFP positive cells are where the fsp1-cre has been expressed. B. C. E. F. H. I. K. L. are H&E stainings of WT and Smad4 cKO cartilages. A-C: Fsp1 is expressed in the ear chondrocytes (A) and the Smad4 cKO mouse has more immature chondrocytes in the ear cartilage (C, arrow) than the WT mouse does (B). D-F: Fsp1 is expressed in the fibrocartilage in the intervertebral discs (D). However, the Smad4 cKO (F) does not show any gross defects compared to WT (E). FC: fibrocartilage. B: bone. G-I: Fsp1 is not expressed in the hyaline cartilage (G) (knee joints are shown here as an example); therefore Smad4 cKO mice (I) have wild type chondrocytes in the hyaline cartilage as the WT mice do (H). HC: hyaline cartilage. Scale bar: 50µm.

