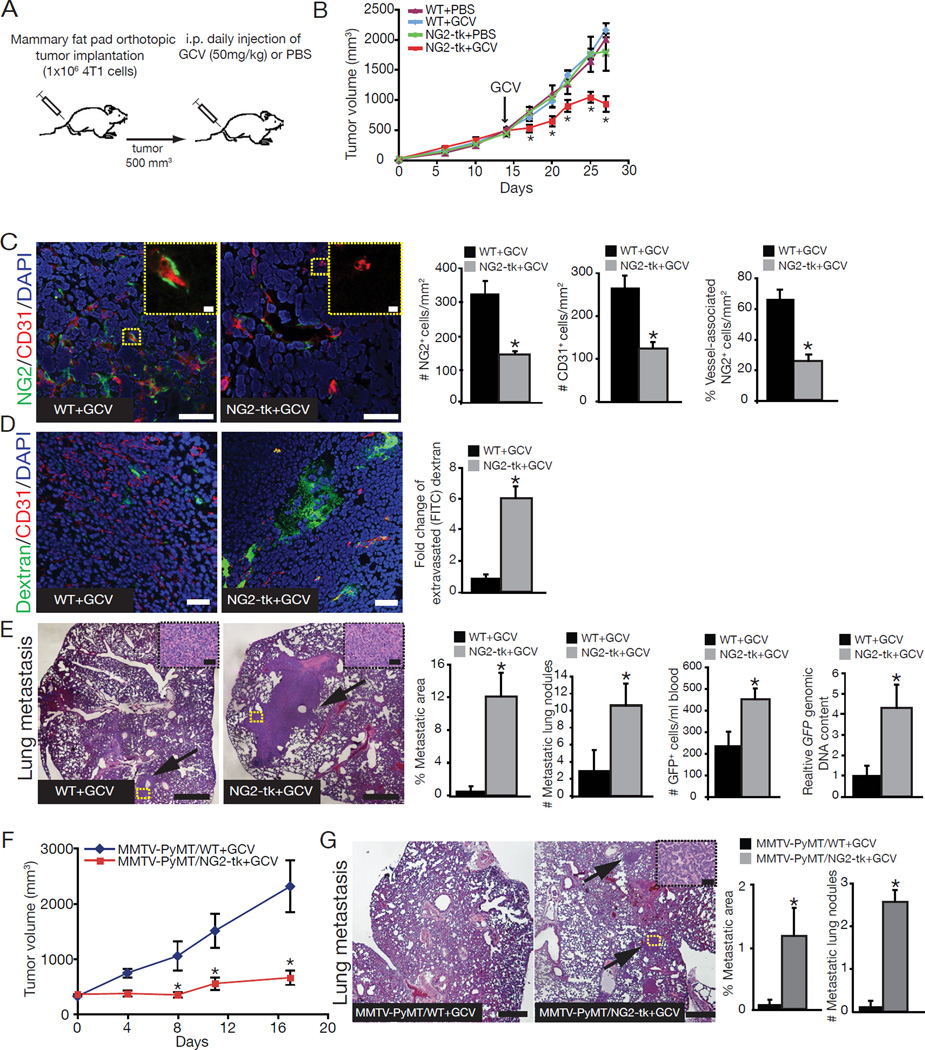
Figure 1. Reduced tumor growth and increased metastasis after depletion of vessel-associated NG2+ cells.
(A) Orthotopic implantation of 4T1 cancer cells in NG2-tk mice and wildtype littermates, with daily ganciclovir (GCV) or saline (PBS) injections beginning when tumors reached ~500mm3. (B) Tumor volumes over the experimental timecourse. (C) Representative images of tumor sections from WT+GCV and NG2-tk+GCV mice immunolabeled for NG2 (green)/CD31 (red), and quantification of number of NG2+ cells, CD31+ cells, and percent vessel-associated NG2+ cells in each group. DAPI=nuclei. Scale bar: 50µm. High magnification images are located in the upper right corner. Scale bar: 10µm. (D) Representative images of tumor sections immunolabeled for CD31 (red) and quantitative analysis of extravascular FITC-dextran. DAPI=nuclei. Scale bar: 50µm. (E) Representative images of H&E-stained lung sections. Scale bar: 10µm. Arrows point to metastatic nodules. High magnification images of metastatic nodules are located in the upper right corner. Scale bar: 50µm. Percent metastatic area, number of metastatic lung nodules, number of 4T1-GFP+ cells in the blood, and relative GFP content in lungs of NG2-tk+GCV mice compared to WT+GCV mice. (F) MMTV-PyMT/WT and MMTV-PyMT/NG2-tk female mice were treated with GCV when tumors reached ~500mm3 and tumor volumes measurements over time. (G) Representative images of H&E-stained lung sections of MMTV-PyMT/WT+GCV and MMTV-PyMT/NG2-tk+GCV mice. Scale bar: 10µm. Arrows point to metastatic nodules. Percent metastatic area and number of metastatic lung nodules. Error bars display SEM; asterisks denote significance (*p<0.05). NS: non-significant. See also Figure S1 and Table S1.

