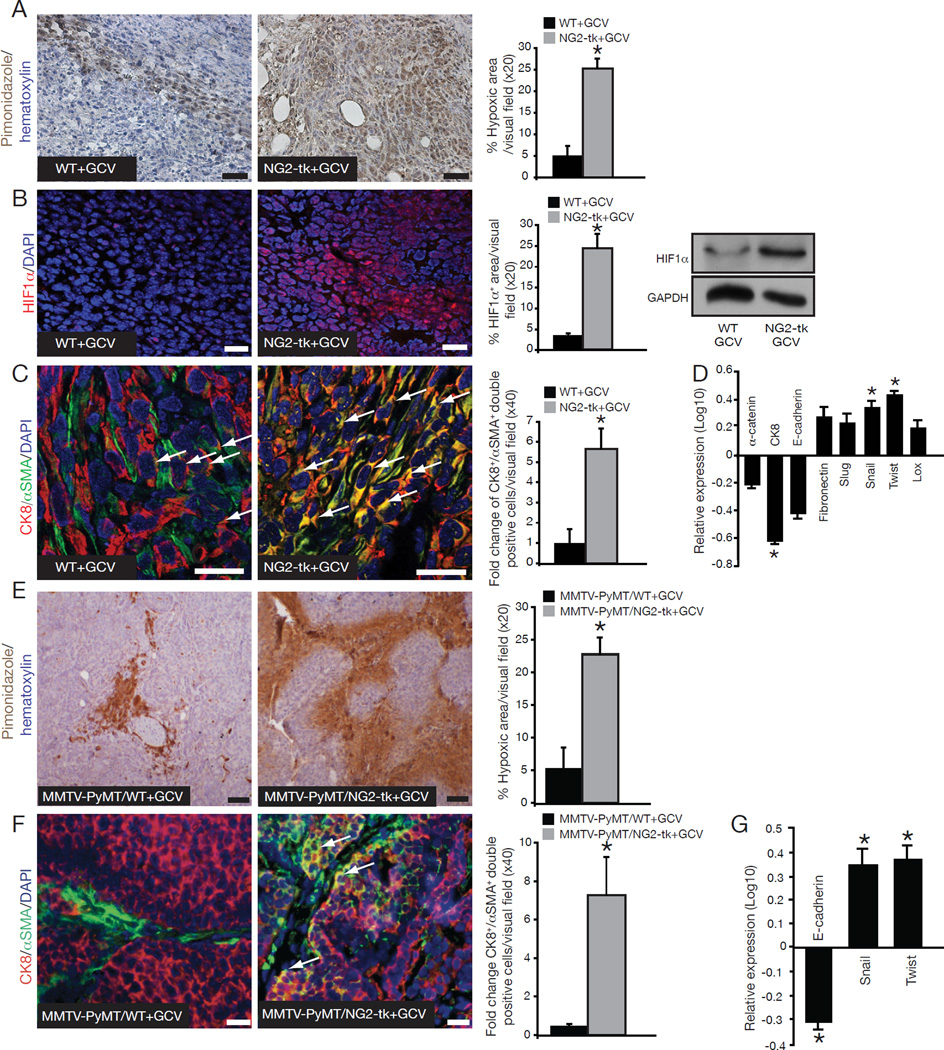
Figure 3. Increase in hypoxia and EMT in pericyte-depleted tumors.
(A) Hypoxia was detected by immunohistochemistry staining of pimonidazole adducts in 4T1 tumor sections from NG2-tk+GCV and WT+GCV mice. Nuclear counterstain: hematoxylin stain. Quantitative analysis of the percent hypoxic area per visual field. (B) Immunostaining for HIF1α. DAPI=nuclei. Quantification of HIF1α immunostaning and Western blot analysis for HIF1α expression; GAPDH is used as an internal control. (C) EMT as detected by immunofluorescent staining for Cytokeratin 8 (red) and αSMA (green). DAPI=nuclei. Arrows point to CK8+/αSMA+ double-positive cells. Quantification of EMT is plotted as fold change in the number of CK8+/αSMA+ double-positive cells per visual field. (D) Quantitative RT-PCR for α-catenin, Cytokeratin 8 (CK8), E-cadherin, Fibronectin, Slug, Snail, Twist, and Lox comparing expression levels in tumor tissues from NG2-tk+GCV mice relative to WT+GCV mice and plotted as log10 relative expression. (E) Representative images of pimonidazole adducts staining (hypoxia). Nuclear counterstain: hematoxylin staining. Quantification of the percent hypoxic area per visual field. (F) EMT as detected by immunofluorescent staining for Cytokeratin 8 (red) and αSMA (green). DAPI=nuclei. Arrows point to CK8+/αSMA+ double-positive cells. Quantification of EMT plotted as the number of CK8+/αSMA+ double-positive cells per visual field. (G) Quantitative RT-PCR for E-cadherin, Snail, and Twist plotted as log10 relative expression. Error bars display SEM; asterisks denote significance (*p<0.05). Scale bar: 50 µm. See also Tables S2–4.

