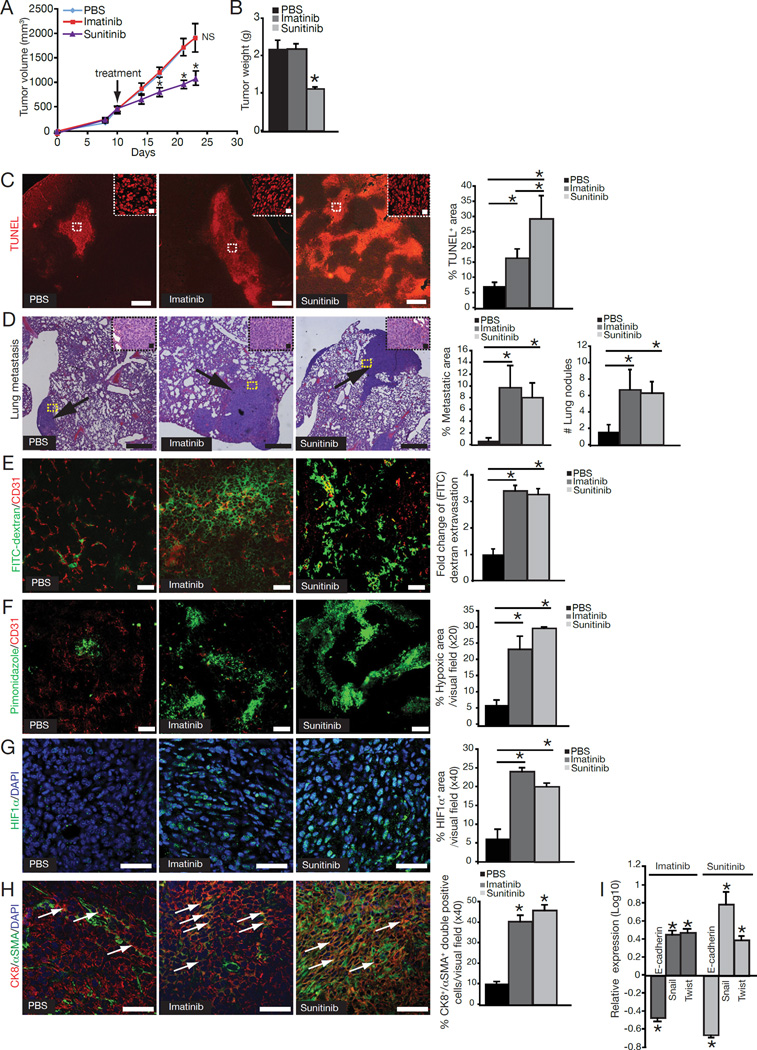
Figure 6. Decreased pericyte coverage, altered vasculature, enhanced EMT, and increased metastasis in Imatinib- and Sunitinib-treated mice.
(A) Orthotopic implantation of 4T1 cancer cells into PBS-, Imatinib- and Sunitinib-treated mice and tumor volumes over the experimental timecourse. (B) Tumor weight at the experimental endpoint. (C) Representative images of TUNEL immunofluorescent labeling and quantification of the percent TUNEL+ area per visual field. Scale bar: 10 µm. High magnification images are shown in the upper right corner. Scale bar: 50 µm. (D) Representative photomicrographs of H&Estained lung sections of control and treated mice. Scale bar: 10 µm. Arrows point to metastatic areas. High magnification images of metastatic nodules are located in the upper right corner. Scale bar: 50 µm. Percent metastatic area and number of metastatic lung nodules. (E) Representative images and quantitative analysis of extravascular FITC-dextran. Scale bar: 50 µm. (F) Representative immunofluorescent images of staining for pimonidazole adducts in tumor sections and quantification. Scale bar: 50 µm. (G) Representative immunofluorescent images and quantification of HIF1α expression. DAPI=nuclei. Scale bar: 50 µm. (H) EMT was detected in 4T1 tumors of control and treated mice by immunofluorescent staining for Cytokeratin 8 (red) and αSMA (green). DAPI=nuclei. Arrows point to CK8+/αSMA+ double-positive cells. Scale bar: 50 µm. Quantification of EMT plotted as percent of CK8+/αSMA+ double-positive cells per visual field. (I) Quantitative RT-PCR analysis for E-cadherin, Snail, and Twist mRNA expression from tumor tissues of control and treated mice and plotted as log10 relative expression. Error bars display SEM; asterisks denote significance (*p<0.05). NS: non-significant. See also Figure S3.

