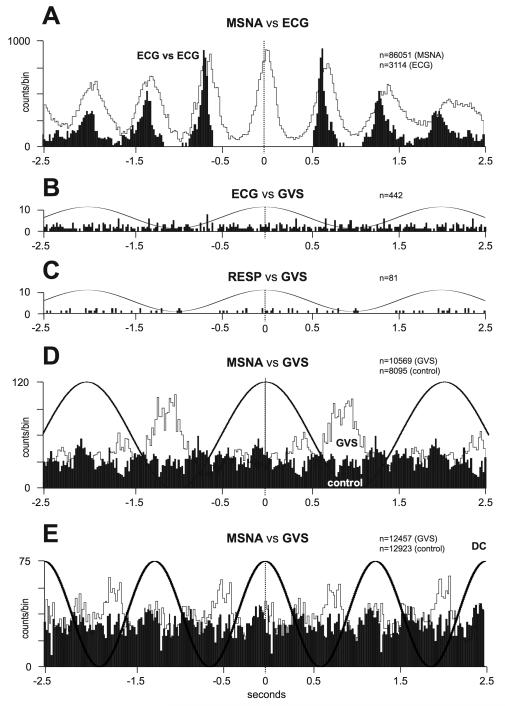
Fig. 12.
Correlations between muscle sympathetic bursts and cardiac and vestibular rhythms. A, cross-correlation histograms of the relationship between muscle sympathetic nerve activity (MSNA) and the electrocardiogram (ECG; white histogram) and autocorrelogram of the ECG (black histogram). B-C, cross-correlation histograms between ECG and galvanic vestibular stimulation (GVS) and respiration (inspiratory peaks) and GVS. A 0.5 Hz sine wave has been superimposed on the histogram to illustrate the timing of the GVS; it has been inverted for clarity. D-E, cross-correlation histograms of MSNA with respect to the vestibular input (GVS), in white, or to a control sine wave (control), in black. Data in panels A-D are from the same subject represented in Fig. 11; data in panel E were obtained from another subject. 20 ms bins in all panels. n = the numbers of counts comprising the histograms. Reproduced from (29), with permission.

