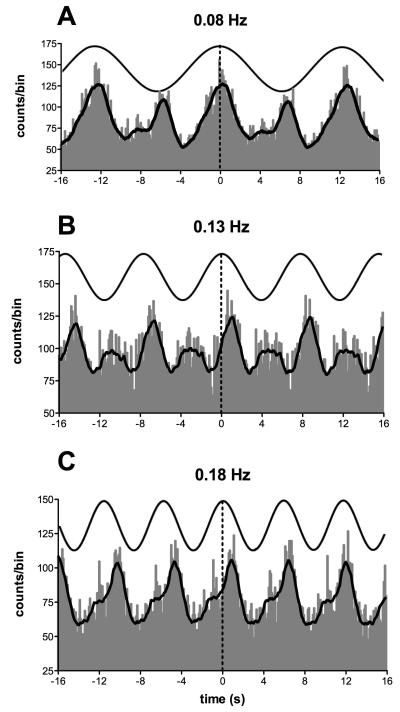
Fig. 14.
Cross-correlation histograms between muscle sympathetic nerve activity (MSNA) and sinusoidal galvanic vestibular stimulation (sGVS) in one subject. The thick curve superimposed on the histograms is the smoothed polynomial that was fitted to the data. The sinusoid above represents the galvanic stimulus, delivered at 0.08, 0.13 and 0.18 Hz. Each cross-correlation histogram shows a large peak of modulation (primary peak), associated with the positive peak of the sinusoid, and a smaller peak (secondary peak). The secondary peak was largest at 0.08 Hz and smallest at 0.18 Hz. Reproduced from (133), with permission.

