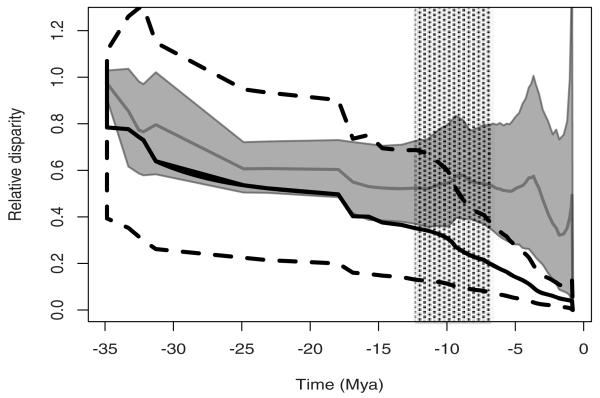
Figure 3.
Relative disparity through time (DTT) for the climatic niche in Androsace. In black, the bold and dashed lines indicate, respectively, the mean and the 5% and 95% quantiles of the Brownian Motion simulations (10 simulations for each resampling step). The bold line in gray and the shaded area indicate the mean and 95% envelope of the observed disparities in the 10,000 resamples taken from niches and trees. As trees have different branching times, all curves are plotted against the mean time of each speciation event across the 100 trees. The dashed area indicates the approximate period between the two appearances of the cushion life form, probably in Asia (−12.5 ± 2.8 Mya) and in Europe (−7.4 ± 2.6 Mya), which seems to coincide with the increase in disparity.

