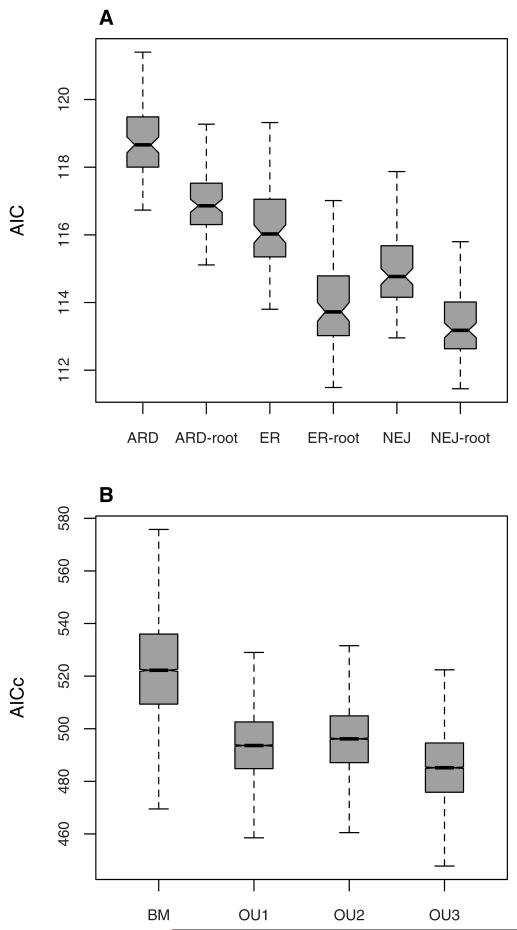
Figure 4.
Evolutionary models comparisons. (A) AIC distributions of the six Mk models fitted on the 100 trees with 62 species. (B) AICc distributions of the four niche evolution models, fitted for 51 species on 10,000 resamples from trees, niches, and ancestral life forms where necessary. All AIC and AICc distributions are significantly different according to Wilcoxon signed-rank tests (all P-values < 0.01).

