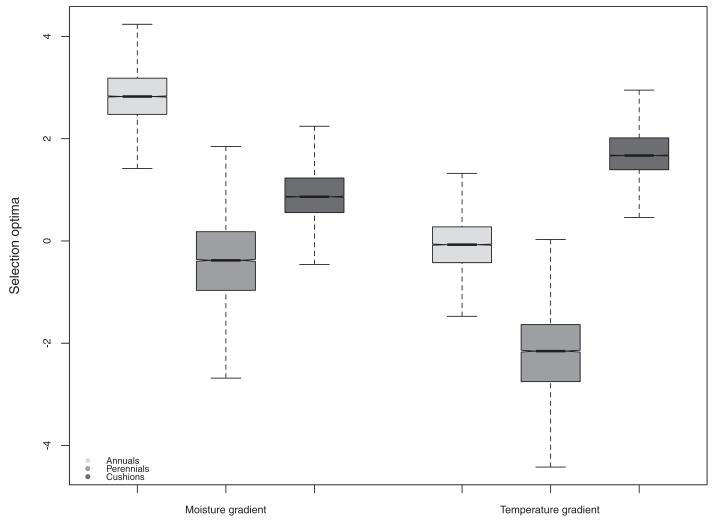
Figure 5.
Estimation of the niche evolutionary optima for the OU3 model on the two main environmental gradients, for the three different life forms. All optima distributions are significantly different according to Wilcoxon signed-rank tests (all P-values < 0.01). The driest niches have been selected in short-lived species and the coldest in cushions.

