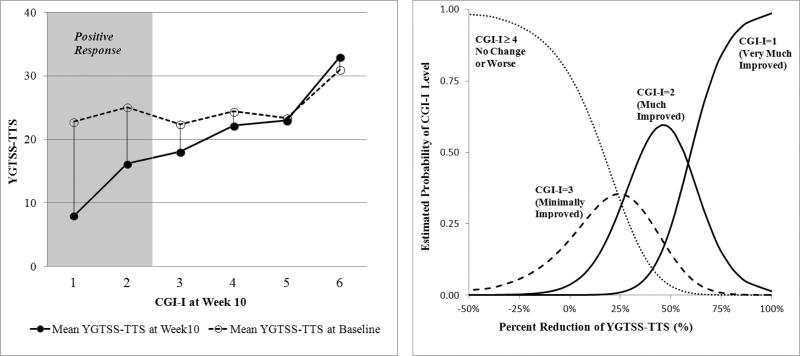
Figure 1. Mean YGTSS-TTS against CGI-I ratings and the estimated probability of CGI-I score based on the percent reduction on the YGTSS-TTS at Week 10 for the entire sample (N=232).
Figure on the left indicates the mean of YGTSS-TTS at baseline (open circles) and Week 10 (black circles). The figure on the right shows the probability of CGI-I score at Week 10 derived from generalized logits model based on the percent reduction on YGTSS-TTS from baseline. For example, a 25% reduction in the YGTSS-TTS has about a 30% chance of being rated Much Improved; a 50% reduction in the YGTSS-TTS has 60% chance of being rated Much Improved. Positive response was defined as Much Improved or Very Much Improved. Thus, the probability of positive response is equal to the probability of Much Improved (CGI=2) plus the probability of Very Much Improved (CGI=1). the probability of CGI=2 decreases as the improvement in the YGTSS-TTS exceeds 50%, but the probability of CGI=1 incrementally increases with greater than 50% improvement in YGTSS. Therefore, the summed probabilities of the CGI=2 and CGI=1 increases as the decline in the YGTSS-TTS exceeds 50%.

