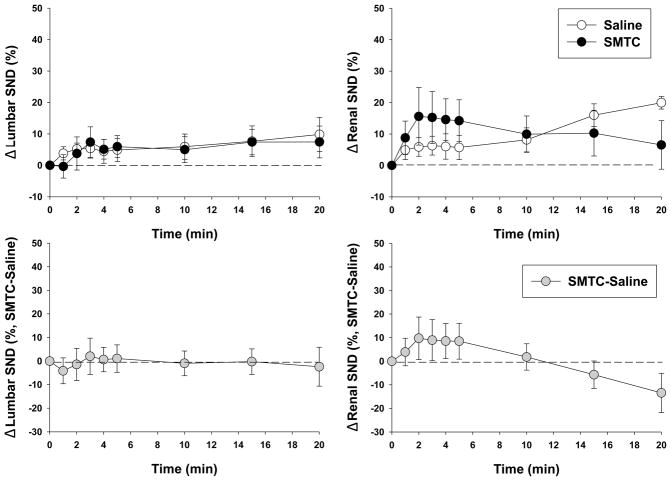
Figure 2.
Effects of saline and SMTC (0.56 mg/kg) infusions on lumbar (n=9) and renal (n=7) SND. There were no differences between saline and SMTC at any time. Time “zero” represents pre-saline or SMTC infusion baseline values. Bottom panels depict the differences between saline and SMTC conditions (Δ SND, SMTC-saline). There were no differences from zero at any time. Data are expressed as mean±SEM.

