Fig. 2.

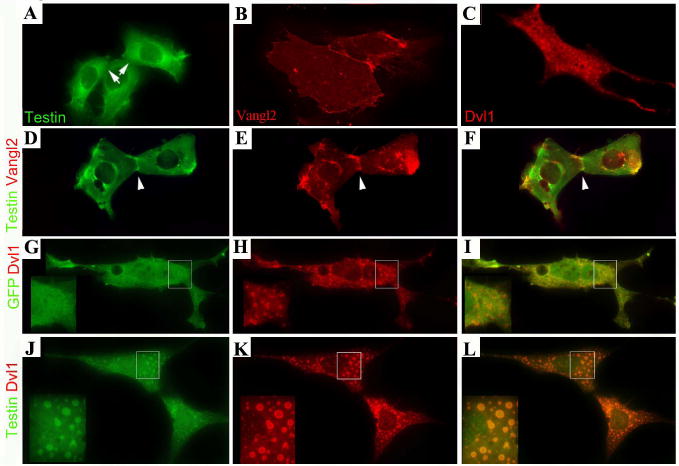
Testin is localized to the same subcellular compartments as Vangl2 and Dvl1.
(A-C) IMCD3 cells transfected with Testin-GFP (A), HA-Vangl2 (B), or HA-Dvl1 (C). The arrows (A) indicate the cellular boundaries of Testin-transfected cells. (D-F) IMCD3 cells transfected with Testin-GFP (green) and HA-Vangl2 (red). The arrowhead marks the cellular boundary with significantly enriched Testin signals in the presence of Vangl2. (G-I) IMCD3 cells transfected with GFP (green) and HA-Dvl1 (red). The inserts are the larger images of the boxed areas in each panel to better visualize the localization of Dvl1 to the vesicular structures and the uniform distribution of GFP in the cells. (J-L) IMCD3 cells transfected with Testin-GFP (green) and HA-Dvl1 (red). The inserts are the larger images of the boxed areas in each panel to visualize the enrichment of Testin-GFP to Dvl1-positive vesicles.
