Figure 1.

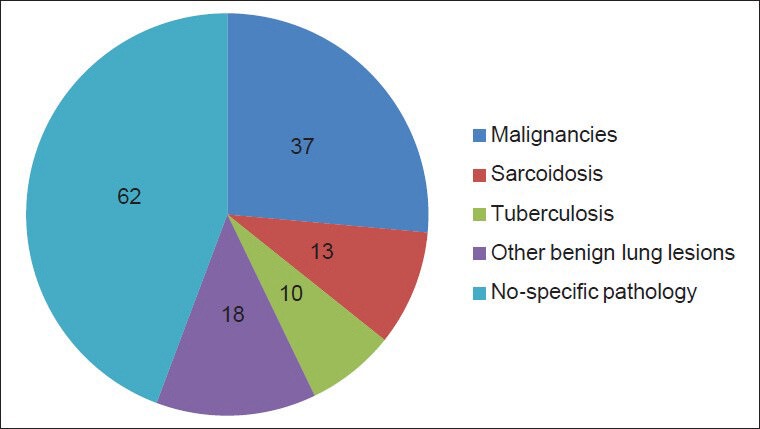
Pie chart showing distribution of different lung lesions in 140 transbronchial lung biopsies specimen included in this study

Pie chart showing distribution of different lung lesions in 140 transbronchial lung biopsies specimen included in this study