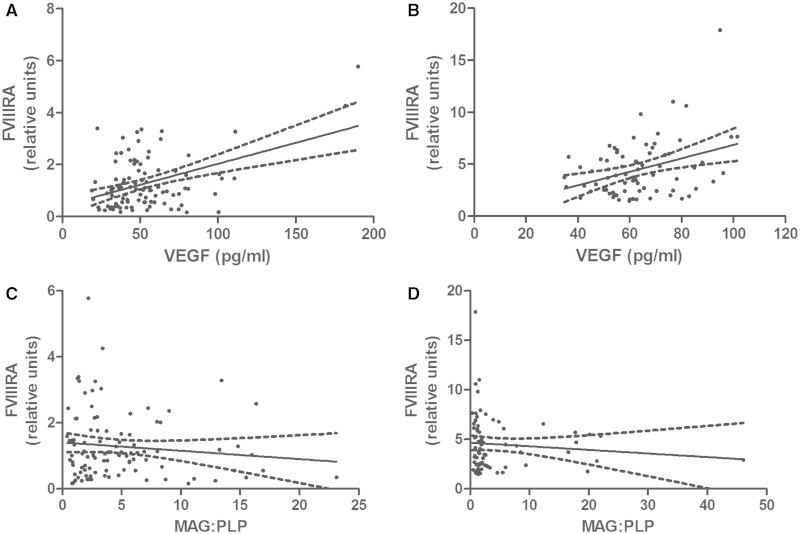
Figure 4.
Scatterplots showing the relationships between FVIIIRA and VEGF concentration (A and B) and MAG:PLP1 ratio (C and D) in the Bristol (A, C) and Oxford (B, D) cohorts. FVIIIRA correlated positively with VEGF concentration in both the Bristol (r = 0.205, P = 0.042) and Oxford (r = 0.253, P = 0.0267) cohorts. FVIIIRA tended to decline slightly with MAG:PLP, but not significantly in either cohort.

