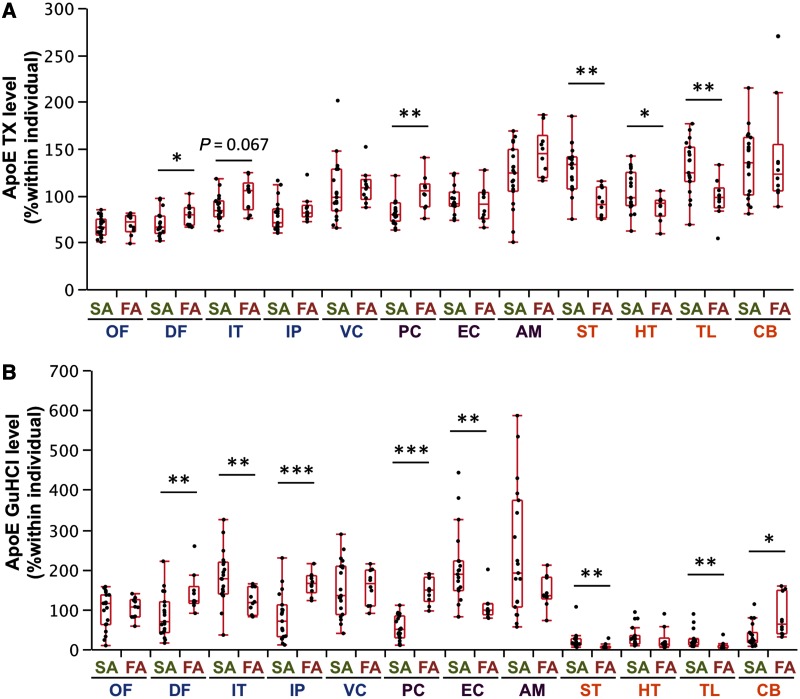
Figure 3.
Comparison of molecules related to amyloid-β metabolism between sporadic and familial Alzheimer’s disease in different brain areas. After normalization within each individual, levels of apoE in the TX fraction (A) and in the GuHCl fraction (B) from cases with sporadic or familial Alzheimer’s disease are plotted for 12 brain areas with a box-and-whisker diagram. *P < 0.05, **P < 0.01, ***P < 0.001; Wilcoxon rank-sum test. AM = amygdala; CB = cerebellum; DF = dorsolateral prefrontal cortex; EC = entorhinal cortex; FA = familial Alzheimer’s disease; HT = hypothalamus; IP = inferior parietal cortex; IT = inferior temporal cortex; OF = orbitofrontal cortex; PC = posterior cingulate cortex; SA = sporadic Alzheimer’s disease; ST = striatum; TL = thalamus; VC = primary visual cortex.

