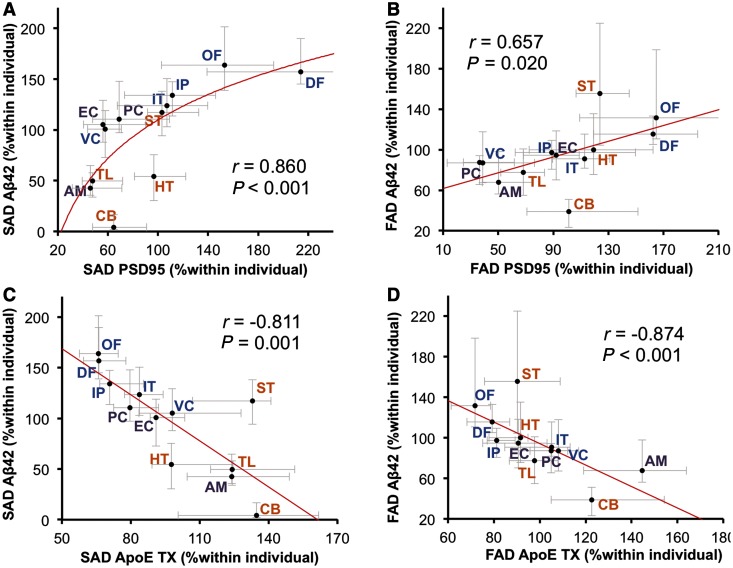
Figure 4.
Regional associations between accumulated amyloid-β and PSD95 or apoE in sporadic or familial Alzheimer’s disease. (A) PSD95 levels in each brain area of cases with sporadic Alzheimer’s disease (SAD) are plotted against amyloid-β42 (Aβ42) levels in the GuHCl fraction in each brain area of cases with sporadic Alzheimer’s disease. (B) PSD95 levels in each brain area of cases with familial Alzheimer’s disease (FAD) are plotted against amyloid-β42 levels in the GuHCl fraction in each brain area of cases with familial Alzheimer’s disease. (C) ApoE levels in the TX fraction in each brain area of cases with sporadic Alzheimer’s disease are plotted against amyloid-β42 levels in the GuHCl fraction in each brain area of sporadic Alzheimer’s disease cases. (D) APOE levels in the TX fraction in each brain area of cases with familial Alzheimer’s disease are plotted against amyloid-β42 levels in the GuHCl fraction in each brain area of familial Alzheimer’s disease cases. Values are median with 25 and 75 percentiles. Correlation coefficient (r) and P-value were acquired by Spearman rank correlation test. AM = amygdala; CB = cerebellum; DF = dorsolateral prefrontal cortex; EC = entorhinal cortex; HT = hypothalamus; IP = inferior parietal cortex; IT = inferior temporal cortex; OF = orbitofrontal cortex; PC = posterior cingulate cortex; ST = striatum; TL = thalamus VC = primary visual cortex.

