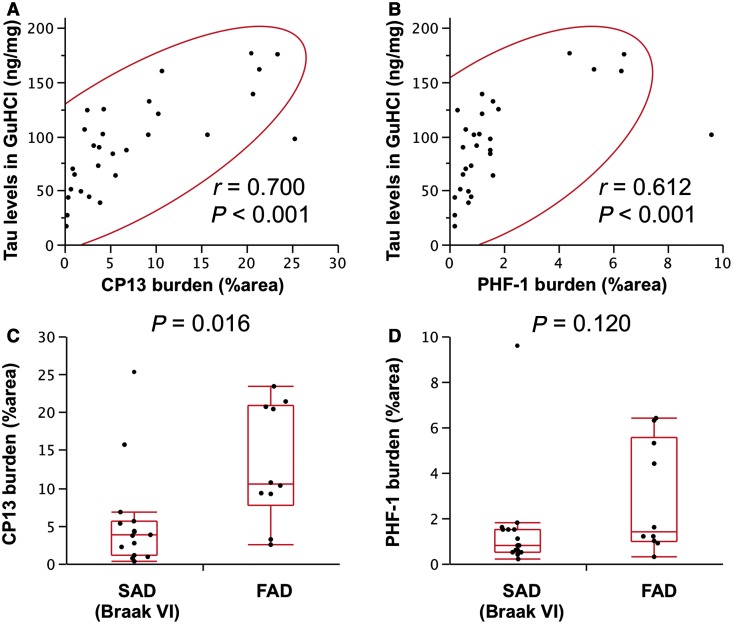
Figure 7.
Immunohistochemical analysis of tau in the striatum. Tau levels in the GuHCl fraction in the striatum (caudate) area of cases with total Alzheimer’s disease are plotted against CP13 burden (A) or PHF1 burden (B) in the striatum (putamen) area of cases with total Alzheimer’s disease with a 95% probability ellipse (red line). Correlation coefficient (r) and P-value were acquired by Pearson correlation test. Tau accumulation detected by CP13 (C) or PHF1 (D) from sporadic Alzheimer’s disease (SAD) cases with Braak neurofibrillary tangles VI stage or familial Alzheimer’s disease (FAD) cases are plotted with a box-and-whisker diagram. P-values were acquired by Wilcoxon rank-sum test.

