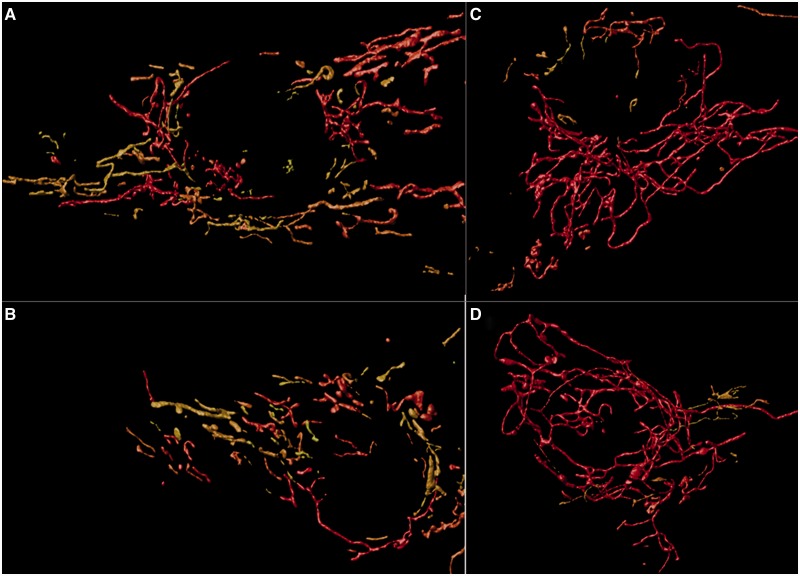
Figure 8.
Representative images from mitochondrial network analysis. Three-dimensional reconstruction of mitochondrial networks using Huygens Essentials software. Networks are colour-coded, in which short networks are yellow and longer networks are red. (A and B) Representative images of the networks from two separate control cell lines. (C and D) Representative images from cell lines derived from Patients 1 and 4, respectively. Qualitatively, one can observe that networks appear to be longer in the patient with compound heterozygous SPG7 mutations. Statistical analysis indicated that SPG7 patient cell networks were on average longer, with fewer networks but increased total volume of mitochondria.

