
Figure 2.
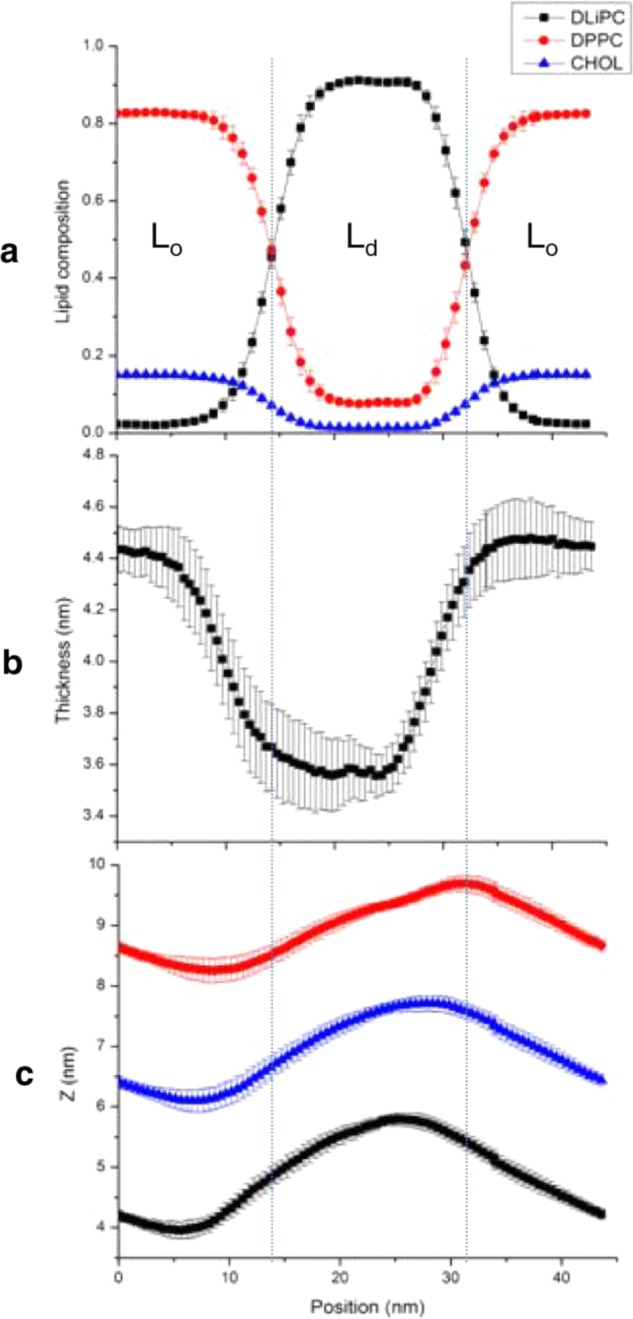
Lipid composition and structural properties of the simulated bilayer. (a) The equilibrium lipid composition in the liquid ordered (Lo) and disordered (Ld) domains. Dotted lines demarcate the approximate domain boundary defined by the intersection point for the DLiPC and DPPC distributions. (b) Bilayer thickness calculated as the average distance between the PO4 beads at the two leaflets. (c) Average shape of the upper (red) and lower (black) monolayers and the midplane (blue) described by the average z-coordinate of the PO4 and the terminal acyl chain beads, respectively. In each panel, data represents average over the 16–25 μs portion of the trajectory; error bars were obtained by time block averaging.