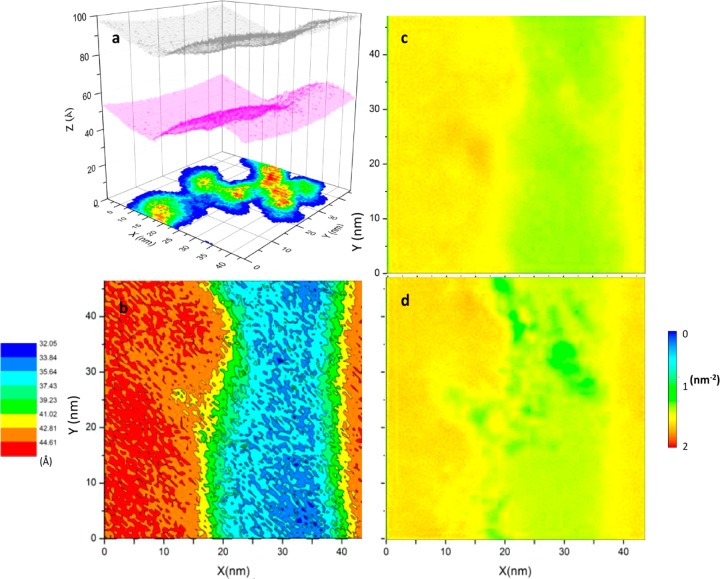
Figure 3.
Variations in structure and composition across the bilayer surface (in the xy-plane). (a) The 3D shape of each monolayer and the location of the aggregate. The upper and lower leaflet, described by the average z-position of the PO4 beads, are in gray and magenta, respectively, whereas the normalized probability distribution of the protein is shown in a heat map from high (red) to low (blue) density. (b) Change in thickness measured by the average distance between the phosphate bead positions within each bin, colored in red/orange for the Lo domain, blue/cyan for the Ld domain and green/yellow for the boundary between the two domains. (c,d) Lipid number density distribution at the upper (c) and lower (d) leaflets in blue (lowest density) through red (highest density).

