Figure 2.

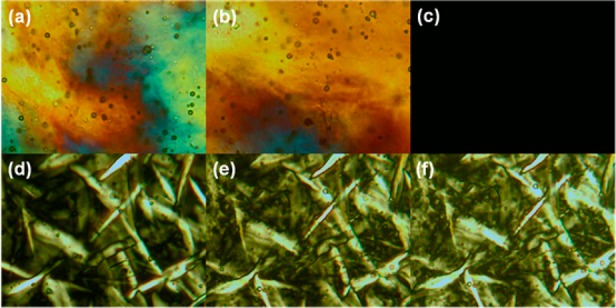
POM textures of GOE-PAS50 at rt (a); upon heating to 90 °C (b) and to 120 °C in the Iso phase (c); and upon cooling from the Iso phase to 90 °C (d), to 60 °C (e), and to rt (f). Image exposure times upon heating and cooling are identical.

POM textures of GOE-PAS50 at rt (a); upon heating to 90 °C (b) and to 120 °C in the Iso phase (c); and upon cooling from the Iso phase to 90 °C (d), to 60 °C (e), and to rt (f). Image exposure times upon heating and cooling are identical.