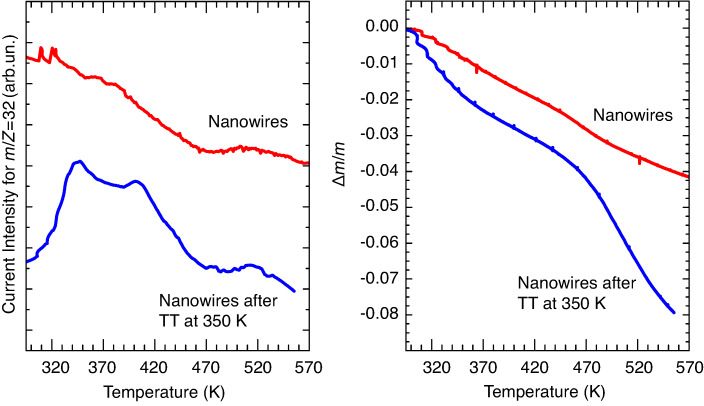
Figure 1.
Temperature dependence of the signal of the mass spectrometer for m/z = 32 (left) and of the total mass variation Δm/m (right), of the as-produced nanowire sample (red lines, sample 1) and of the nanowire specimen after a thermal treatment (TT) at 350 K for 24 h in vacuum (blue lines, sample 2).

