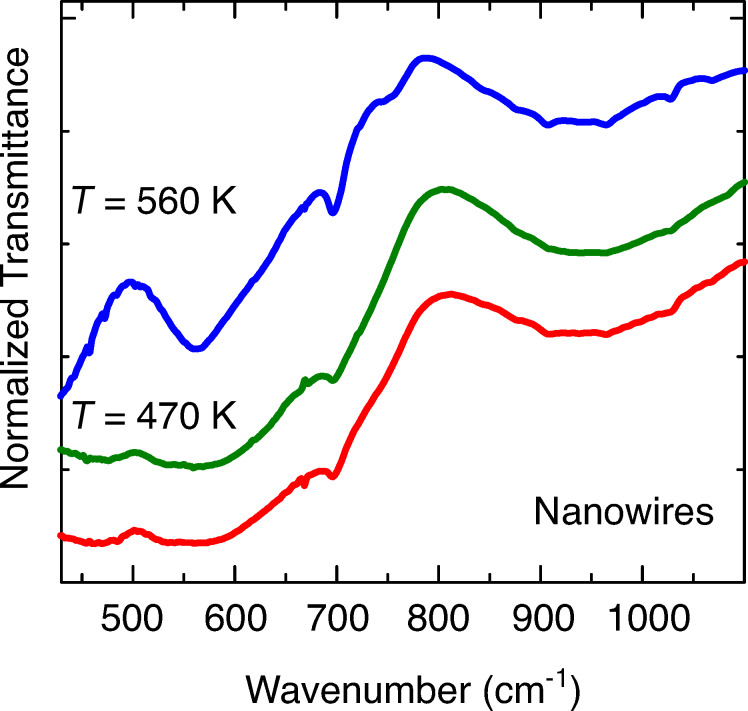
Figure 2.
Infrared spectrum (normalized transmittance signal) of the nanowire sample (sample 2, red line), and of the specimen obtained from sample 2 after a thermal treatment at 470 K (sample 3, green line) and at 560 K (sample 4, blue line). In order to compare the transmission of different oxide powders, the transmittance spectra have been normalized. Data are vertically stacked, for the sake of clarity.

