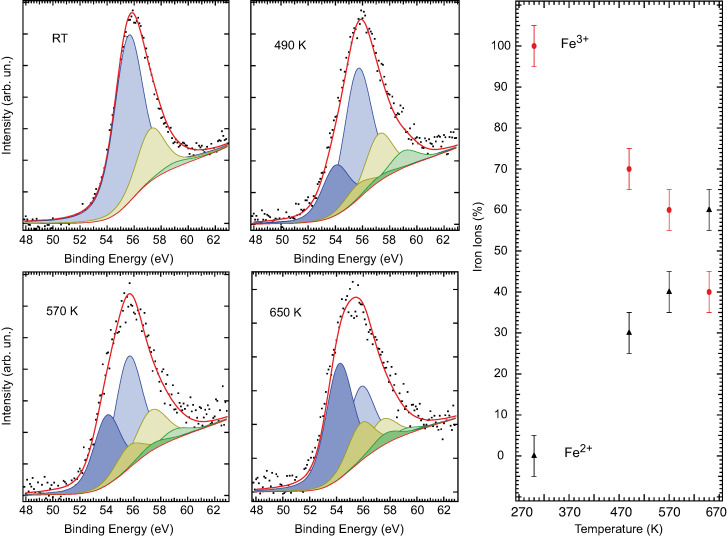
Figure 4.
XPS of the Fe 3p core levels as a function of the annealing temperature. Left panels: XPS rough data (black dots), total fitting curves (red continuous lines), along with the deconvolution with contributions associated to the Fe3+ (light color curves) and Fe2+ (darker color curves) manifold components. Right panel: relative intensity estimations of the Fe3+ (red dots) and Fe2+ (black triangles) content in the NWs as a function of the temperature, as obtained from the fitting of the XPS experimental data (see text).

