(
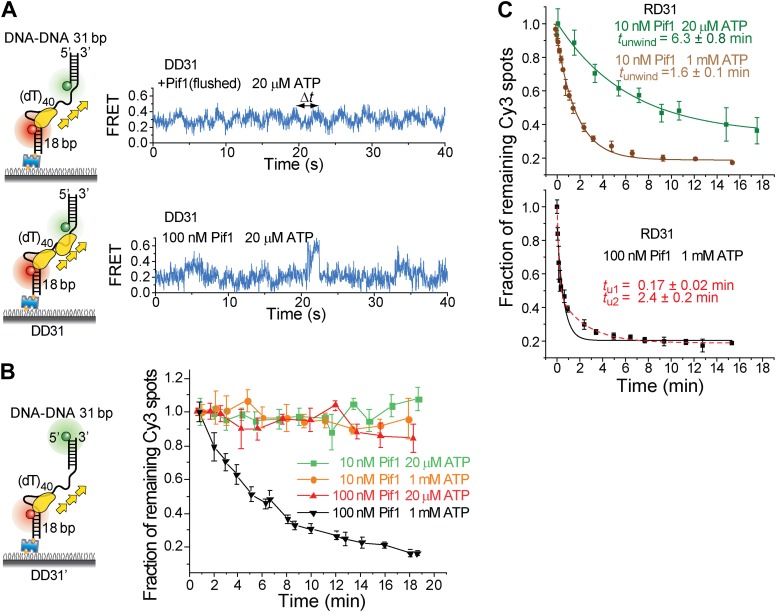
A) Single molecule time traces of Pif1 dynamics on DD31 at two different protein concentrations. After incubating 10 nM Pif1 and flushing out unbound Pif1 (we refer to this condition as the Pif1 monomer condition), single molecule time traces were obtained at 20 μM ATP (top panel). Periodic wave patterns were observed, indicating that a single Pif1 monomer periodically patrols the (dT)
40 ssDNA segment. In contrast, in single molecule time traces obtained at 100 nM Pif1 and 20 μM ATP, the regular wave patterns were disrupted (bottom panel), likely due to the binding of multiple Pif1 monomers or protein oligomerization on the substrates at 100 nM Pif1 (
Barranco-Medina and Galletto, 2010;
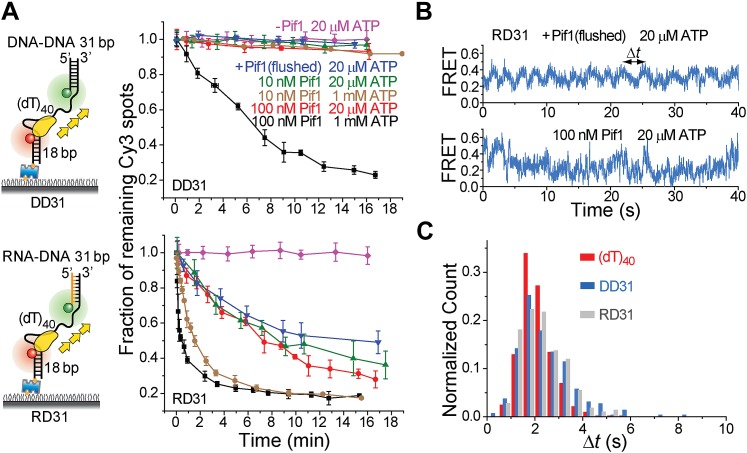
Galletto and Tomko, 2013). Similar time traces were obtained under the same conditions for RD31, a gapped substrate containing a 31-bp RNA–DNA hybrid (
Figure 3B). (
B) Unwinding curves for DD31′ obtained under different conditions. DD31′ is a gapped DNA substrate slightly modified from DD31 by repositioning the Cy3 fluorophore, and is used to test whether the presence of a Cy3 fluorophoe at the ss–dsDNA junction would affect Pif1 unwinding. (
C) Unwinding curves for RD31 with exponential fits. Solid lines are single exponential fits. The red dashed line is a bi-exponential fit. At 10 nM Pif1 (the monomer condition), the unwinding curves can be fit well with a single exponential function. However, at 100 nM Pif1, the unwinding curve cannot be fit well with a single exponential function (black solid line), and a bi-exponential function characterized by two unwinding phases (red dashed line) can well describe the curve.


