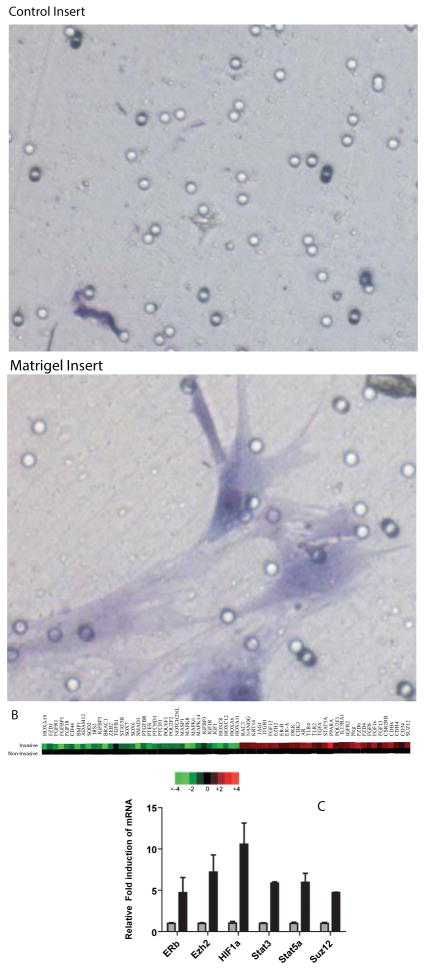
Figure 1. Gene expression changes in invasive hMSCs.
A) Microscopic images (20X) of cells invaded toward SCM after 24 hours using either control inserts or inserts containing Matrigel. Cells were staining with the Diffi-Quick Staining kit.
B) Heat Maps demonstrating increased (red) or decreased (green) expression of a select number genes from the invasive compared to non-invasive cells. Samples were hybridized to an Agilent whole genome gene expression array following manufacturer’s directions. Arrays were scanned using a GenePix 4000B scanner (Molecular Devices, Sunnyvale, CA) and analyzed using Cluster and Treeview offered by Michael B. Eisen as freeware (http://rana.lbl.gov/EisenSoftware.htm). The complete list of genes whose expression changed ≥1.8- or ≤1.8-fold is available in Supplemental Table S1.
C)A select number of up-regulated genes were verified using qRT-PCR for increased expression in the invasive cells. Gray bars represent the non-invasive cell expression normalized to 1 and black bars are relative fold-induction of mRNA from invasive cells. Fold induction was calculated using the Delta-Delta CT method where the non-invasive cells were set at 1.0 as the control, and 18S rRNA was used as a loading control. Data is shown as transformed log2. A Twoway ANOVA with a Bonferroni post-test was performed to compare groups and * represents a p-value of < 0.05 comparing invasive to non-invasive cells.

