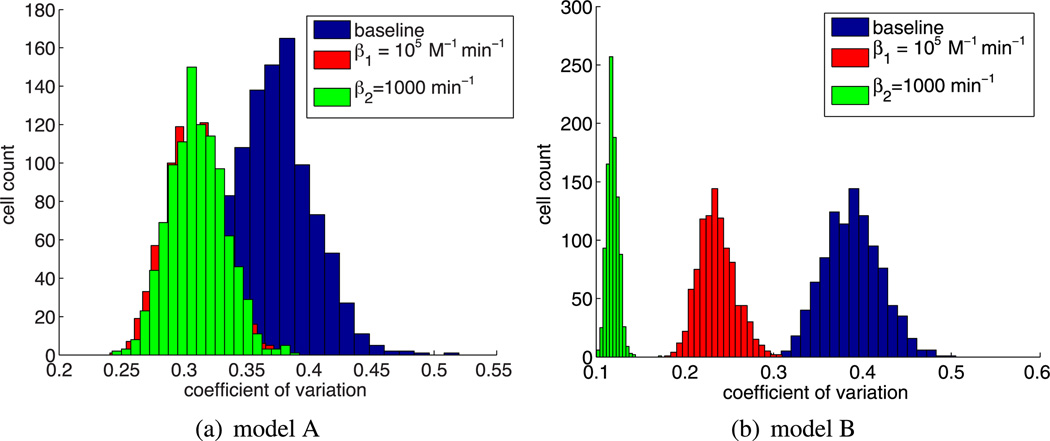
Fig. 10.
Coefficient of variation distributions for the different dimer disruption model scenarios (as indicated in the legends). While there is an effect on model A, the effect is much greater in model B. Low values of the coefficient of variation correlate with non-oscillatory solutions with sustained high protein levels or oscillations with a very low amplitude (Color figure online)

